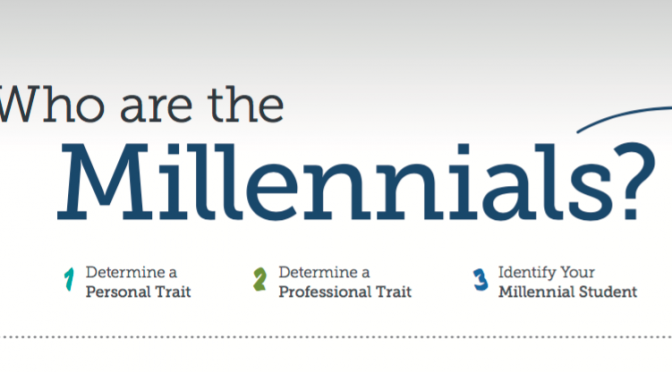
This EAB infographic subdivides the millennial student market by personal and professional traits.
[embeddoc url=”https://blogs.uoregon.edu/edtechknowledge/files/2016/05/30590_COEF_Infographic_Final-1uxs6hc.pdf” download=”all” viewer=”google”]
This EAB infographic subdivides the millennial student market by personal and professional traits.
[embeddoc url=”https://blogs.uoregon.edu/edtechknowledge/files/2016/05/30590_COEF_Infographic_Final-1uxs6hc.pdf” download=”all” viewer=”google”]
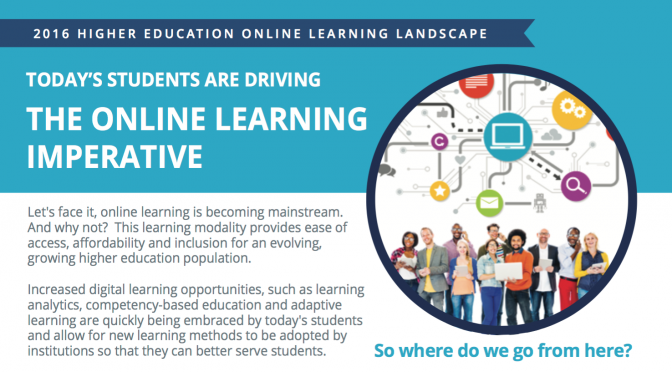
This infographic from the Online Learning Consortium sums up emerging trends in technology and higher ed in 2016, and encourages further growth in ed tech.
[embeddoc url=”https://blogs.uoregon.edu/edtechknowledge/files/2016/05/OLC2016ONLINELEARNINGIMPERATIVEINFOGRAPHIC-1gi3e42.pdf” download=”all” viewer=”google”]
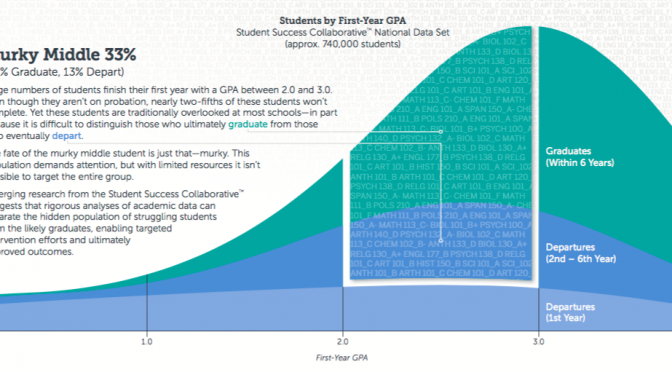
This EAB infographic illustrates the correlations between first-year GPA and degree completion rates, with an emphasis on those students with GPAs between 2.0 and 3.0.
[embeddoc url=”https://blogs.uoregon.edu/edtechknowledge/files/2016/05/29636_SSC_Infographic-1gkip7n.pdf” download=”all” viewer=”google”]
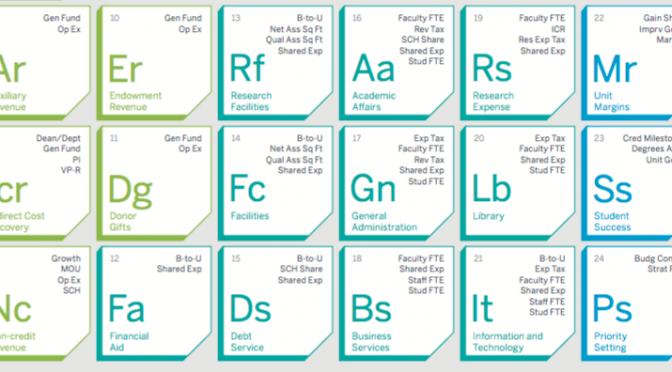
This EAB infographic illustrates the core elements and varied mechanisms of university budget modeling.
[embeddoc url=”https://blogs.uoregon.edu/edtechknowledge/files/2016/05/29019-BAF-Periodic-Table-2j28qdj.pdf” download=”all” viewer=”google”]
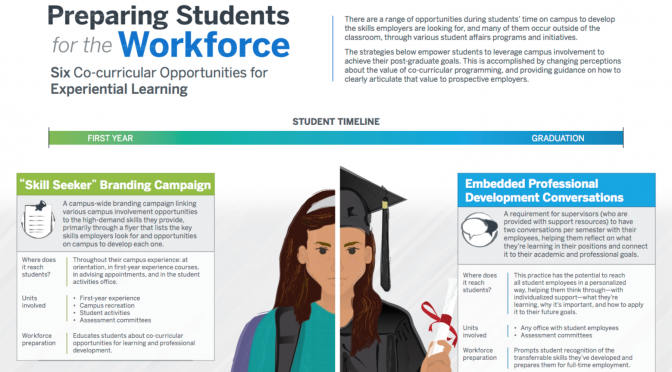
This EAB infographic illustrates six opportunities for experiential learning that can help keep students on track to graduate and ensure better preparation for the workforce.
[embeddoc url=”https://blogs.uoregon.edu/edtechknowledge/files/2016/05/SAF-Experiential-Learning-Infographic-xdazlg.pdf” download=”all” viewer=”google”]
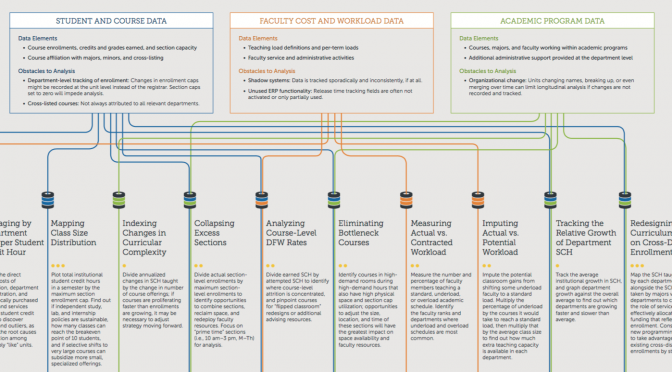
This EAB infographic illustrates ten ways in which technological information or data can help improve university decision making.
[embeddoc url=”https://blogs.uoregon.edu/edtechknowledge/files/2016/05/30667_EAB_ITF_Infographic_Final_NoCrop-1hkdacv.pdf” download=”all” viewer=”google”]
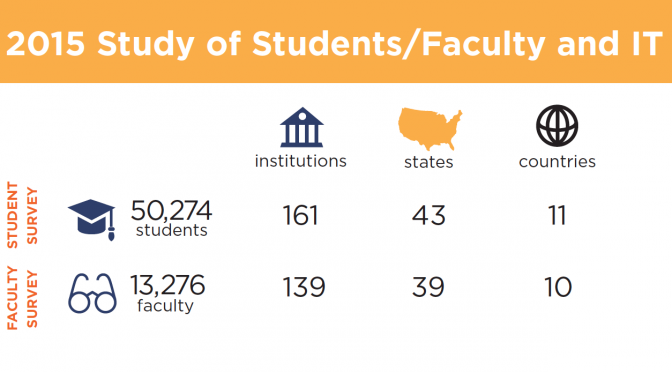
This infographic summarizes findings from the EDUCAUSE Center for Research and Analysis’s 2015 Study of Students and Technology and 2015 Study of Faculty and Technology. Custom UO results from these studies are available from Information Services.
[embeddoc url=”https://blogs.uoregon.edu/edtechknowledge/files/2016/02/eig1510-12e8rr0.pdf” download=”all” viewer=”google”]
A visual overview of student reliance on mobile devices versus institutional and faculty priorities for learning.
94% of higher education leaders agree that students should have access to applications and data anywhere, on any device, but 55% said their institution does not provide this level of access to students today.
[embeddoc url=”https://blogs.uoregon.edu/edtechknowledge/files/2015/11/CitrixStudentMobileWorkspacesInfographic-17vcaz8.pdf” download=”all” viewer=”google”]
CampusTechnology provides a snapshot of how students consider and use mobile devices in their Student Mobile Workspaces Infographic, including:
94% of higher education leaders agree that students should have access to applications and data anywhere, on any device, but 55% said their institution does not provide this level of access to students today.
If you are a member you can read more about this infographic in CampusTechnology, September 17, 2015.