Brain Hack 2017!

The UO site for Brainhack Global is being organized by Kate Mills, a post-doc in the Developmental Social Neuroscience lab (along with help from many others). Don’t let the Brain in Brainhack fool you — this is an event for anyone who wants to work on programming, analysis, and data related to the study of brain, mind and behavior!

We are hosting a Brainhack on March 4-5 as part of a global initiative, and we are inviting you to join us save the date!

This event will bring together neuroscientists, psychologists, biologists, and computer scientists to collaborate on participant-directed projects related to open science, software, and data. Come with a project idea of your own, or just excitement to collaborate with others.

Brainhack Global 2017 will unite regional events occurring the same week at 40+ different sites. We are participating as the only site in Oregon.

If you’re interested in attending and want to receive updates on Brainhack 2017, please fill out this form.

We hope to see you there!
Kate, Dani, John, Jenn, Theresa, Nandi and the rest of the DSN Lab

FAQ:
What’s going to happen at Brainhack?
Prior to our event, we will collect project ideas from attendees. Attendees can pitch project ideas to work on or join proposed project teams. We will all contribute to projects during times for open hacking and present our progress at the end of Brainhack. There will also be mini-unconferences, which are an opportunity to discuss topics of interest with other attendees, related to their areas of expertise.

What kind of projects can I work on?
Current project pitches include contributing to open science programs, such as NeuroVault and Brain Imaging Data Structure Apps. We welcome any projects related to the study of the brain and/or behavior.

I have a project idea! How can I let others know about it?
Great! Please fill out this form to let others know about your project idea! Since the event is only two days long, project pitches should be submitted here prior to the start of the event so that we can hit the ground running.

I don’t have a project idea. What should I do?
It’s okay if you don’t have a project idea of your own, because other projects will need your skills and support. Take a look at this spreadsheet to look at current project ideas. All skills are valued at a Brainhack–you can always be a beta tester!

I don’t have a background in neuroscience -and/or- I don’t have strong programming skills. Can I still attend?
Yes! All are welcome. The purpose of Brainhack is to bring together people with different skills to learn from one another.
This week in R Club

Today we’ll start with a consultation:

I am running some machine learning “decoding” analyses on EEG data, and am trying to figure out the best way to assess these effects using statistical tests. Each subject produces something similar to a correlation matrix (confusion matrix), and I need to figure out what statistical test will be appropriate considering the non-independence of the observations.

Then we’ll move on to machine learning in R. Last week we compiled a bunch of learning resources. This week we’ll come up with a plan for traversing this stuff, and begin!

Machine Learning in R: Resources

Last week we decided that everyone was interested in learning machine learning in R, and that we’d end up getting more proficient with version control along the way. The rest of the session was spent identifying resources — here’s a list we’ll add to as the quarter continues:

Welcome to wintR!

R Club is on Thursdays from 2:00-3:30p in 008 STB

As always, R Club is available for anyone interested in spend a bit more time in any given week on scientific computing. Come with a question you’d like help with, or a cool new thing you’d like to show and tell. The best way to get the conversation started is via the SlackR group here: https://uorclub.slack.com. Sign up with your uoregon.edu email address for immediate access.

The guiding structure this winter quarter is going to be pseudo-hackathon style. We’re going to try to form a few different working groups with the goal of learning a new scientific computing skill, and use R Club as protected time to hack away at those skills. Today, we’ll pitch ideas, and people can choose to join up. Having a folks working on building these skills all in the same room will hopefully provide a supportive environment where questions and difficulties can be overcome quickly.

Here are some possible working-group topics:

  • Machine learning in R (or Python?)*
  • Version control*
  • R Markdown → APA Formatted manuscripts
  • Text Mining
  • Shiny Apps

* This one is definitely happening!

Quick and easy meta-anlysis using metafor

Lou Moses is going to present today on how to use the metafor package today.

Being able to do a meta-analysis in depth, or on the fly, is something I’ve come to view as nearly as important a basic skill as the t-test. It’s indispensable whether you’re trying to get a quick estimate of effect size across a literature for a power analysis, concerned about publication bias, or attempting to produce a definitive summary of a literature. And metafor in R is a really easy to use tool for doing that.

Code to Transfer Package Library

Want to update R AND keep all your packages? Here is the code I used, and this is the website I got it from: https://www.datascienceriot.com/how-to-upgrade-r-without-losing-your-packages/kris/

1. Before you upgrade, build a temp file with all of your old packages.

tmp <- installed.packages()
installedpkgs <- as.vector(tmp[is.na(tmp[,"Priority"]), 1])
save(installedpkgs, file="installed_old.rda")

2. Install the new version of R and let it do it’s thing.

3. Once you’ve got the new version up and running, reload the saved packages and re-install them from CRAN.

load("installed_old.rda")
tmp <- installed.packages()
installedpkgs.new <- as.vector(tmp[is.na(tmp[,"Priority"]), 1])
missing <- setdiff(installedpkgs, installedpkgs.new)
install.packages(missing)
update.packages()
Written by Comments Off on Code to Transfer Package Library Posted in Resources

Week 6 – Simulation, Power

screen-shot-2013-10-14-at-12-53-34-pm

This week we’re going to talk about one of my favorite things: simulation!

Simulation is one of the most useful tools I’ve come across. You can use it to test how your data and statistical tests behave when certain assumptions are violated, how much power you have to detect a true effect, and more generally it helps you think about what you expect from the data generating process you’re interested in.

Also, for those of us who haven’t written a formal mathematical proof in awhile, it’s a simple way to demonstrate statistical problems and solutions without slogging through complicated equations.

Our strategy for today:

We’ll start by looking at how to draw numbers from distributions (e.g., the normal distribution), how to do this repeatedly to simulate sampling from a population, and then how to do that repeatedly to simulate running multiple studies (hopefully this builds up a crucial bit of insight about how frequentist statistics work, too).

After that, we’ll look at some tools (lavaan and simsem) that you can use to simulate more complicated experimental designs.

Resources

Dealing with “missing”/out of bounds values in heatmaps

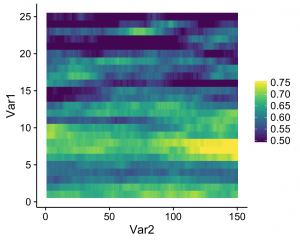
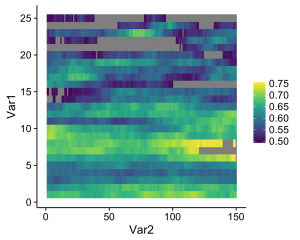
I was tinkering around in R to see if I could plot better looking heatmaps, when I encountered an issue regarding how specific values are represented in plots with user-specified restricted ranges. When I’m plotting heatmaps, I usually want to restrict the range of the data being plotted in a specific way. In this case, I was plotting classifier accuracy across frequencies and time of Fourier-transformed EEG data, and I want to restrict the lowest value of the heatmap to be chance level (in this case, 50%).

I used the following code to generate a simple heatmap:

decoding <- readMat("/Users/Pablo/Desktop/testDecoding.mat")$plotData
plotDecoding <- melt(decoding)

quartz(width=5,height=4)
ggplot(plotDecoding, aes(x = Var2, y = Var1)) +
geom_tile(aes(fill = value)) +
scale_fill_viridis(name = "",limits = c(0.5,0.75))

And this is what I got:

heatmap1

See the gray areas? What’s happening here is that any data points that fall outside of my specified data range (see the limits argument in scale_fill_viridis) are being converted to NAs. Apparently, NA values are plotted as gray by default. Obviously these values are not missing in the actual data; how can we actually ensure that they're plotted? The solution comes from the scales package that comes with ggplot. Whenever you create a plot with specified limits, include the argument oob = squish (oob = out of bounds) in the same line where you set the limits (make sure that the scales package is loaded). Ex:

scale_fill_viridis(name = "",limits = c(0.5,0.75),oob=squish)

What this does is that values that fall below the specified range are represented as the minimum value (color, in this case), and values that fall above the range are represented as the maximum value (which seems to be what Matlab defaults to). The resulting heatmap looks like this:

heatmap2

A simple solution to an annoying little quirk in R!

Looking at interactions of continuous variables

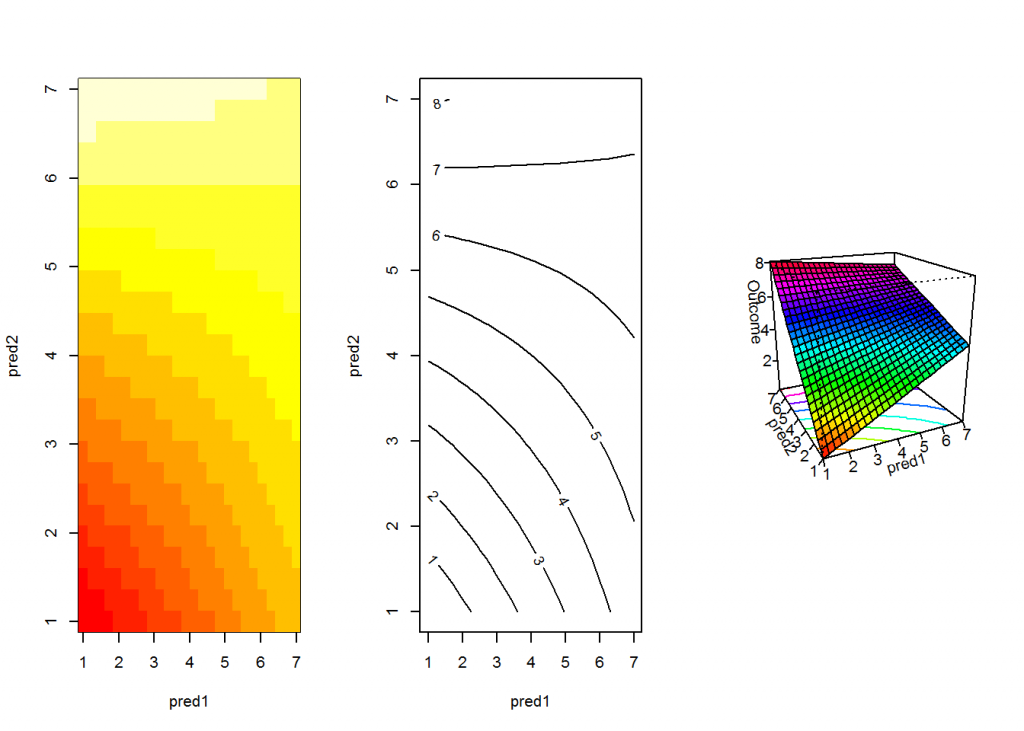
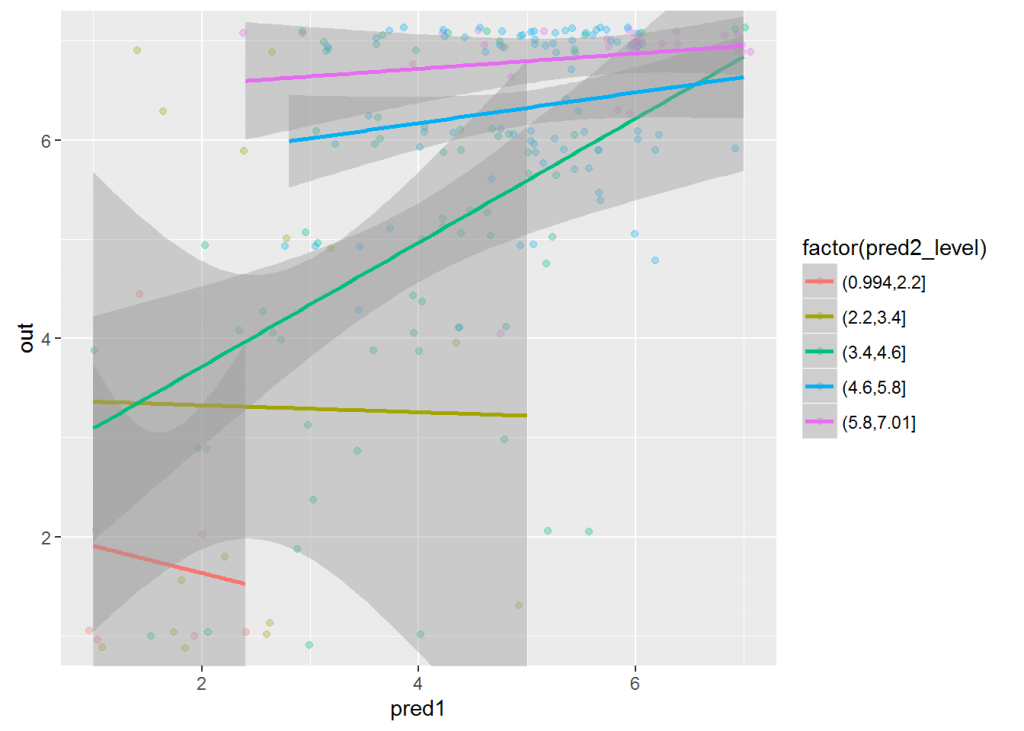
So we had an unexpected interaction effect between two continuous predictors in our dataset. I thought it was some kind of ceiling effect so I did some plots to see what was causing it. I still think it’s a ceiling effect, but I also found it interesting that the effect of predictor 1 is only really present at average levels of predictor 2. Anyway, I’ve attached my code. If you have an interaction that you can’t quite understand, these plots may help: http://rpubs.com/abcharlton/interaction-plots.

download-1

download