Tagged: tools

Interactive Embedded Plots with Plotly and ggplot2


Largley lifted from this r-bloggers post

install.packages("devtools")  # so we can install from GitHub
devtools::install_github("ropensci/plotly")  # plotly is part of rOpenSci
library(plotly)

py <- plotly(username="jflournoy", key="mg34ox914h")  # open plotly connection
# I'll change my key after this, but you can still use: plotly(username="r_user_guide", key="mw5isa4yqp")
# Or just sign up for your own account!

 
gg <- ggplot(iris) +
    geom_point(aes(Sepal.Length, Sepal.Width,color=Species,size=Petal.Length))
gg

#This looks a little object-oriented like python  
py$ggplotly(gg)

You can embed code like this (which you get from the plotly ‘share’ dialogue):

<div>
<a href="https://plot.ly/~jflournoy/16/" target="_blank" title="Sepal.Width vs Sepal.Length" style="display: block; text-align: center;"><img src="https://plot.ly/~jflournoy/16.png" alt="Sepal.Width vs Sepal.Length" style="max-width: 100%;width: 797px;"  width="797" onerror="this.onerror=null;this.src='https://plot.ly/404.png';" /></a>
<script data-plotly="jflournoy:16" src="https://plot.ly/embed.js" async></script>
</div>
Sepal.Width vs Sepal.Length

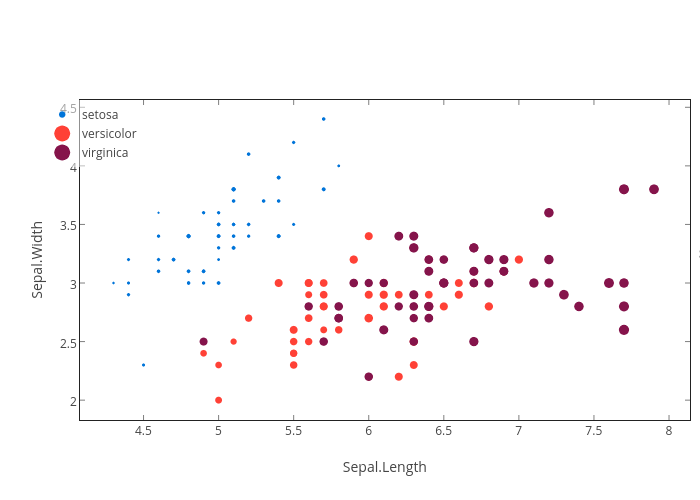
You can also directly embed a plotly plot using a code chunk if you set plotly=TRUE for the chunk, and include session="knitr" in the call.

#Set `plotly=TRUE`
py$ggplotly(gg, session="knitr")

There’s a wide world of plotly fun just waiting out there.


dplyr

So useful!

http://cran.rstudio.com/web/packages/dplyr/vignettes/introduction.html

Hadley explains (at the above link):

The dplyr package makes each of these [data processing] steps as fast and easy as possible by:

  • Elucidating the most common data manipulation operations, so that your options are helpfully constrained when thinking about how to tackle a problem.
  • Providing simple functions that correspond to the most common data manipulation verbs, so that you can easily translate your thoughts into code.
  • Using efficient data storage backends, so that you spend as little time waiting for the computer as possible.

The dplyr debut blog post may also be of interest.

centering and standardizing with scale()

Welcome to some handy functions! These are quick ways to get some common tasks done: centering, standardizing, and getting stats (i.e. mean) for each level of a factor.


# get some data to play with
data()
# Ooo! Chickens. Let's use the ChickWeight dataset.
df <- ChickWeight str(df) summary(df) head(df) # ------------------- # # centering # # ------------------- # ?scale df$weight.c <- scale(df$weight, center=TRUE, scale=FALSE) hist(df$weight.c) # ---------------------------- # # scaling (z scores) # # ---------------------------- # df$weight.z <- scale(df$weight, center=TRUE, scale=TRUE) hist(df$weight.z) # ----------------------------------- # # within levels of a factor # # ----------------------------------- # # lots of great ways to do this, here are two (there are so many more!) # strategy number 1 ?ave df$ave.weight <- ave(df$weight, df$Chick) head(df, n=15) # you don't have to stick with the mean. you can put in any function you like. df$max.weight <- ave(df$weight, df$Chick, FUN=max) # you can center within levels of a factor! df$weight.z.within <- ave(df$weight, df$Chick, FUN=scale) head(df, n=15) # strategy number 2 ?by hist(by(df$weight, df$Chick, FUN=mean), main = "How heavy are those chickens??") # note that this one produces only one mean for each chick: length(unique(df$Chick)) length(by(df$weight, df$Chick, FUN=mean)) nrow(df) # you can put in any function you like hist(by(df$weight, df$Chick, FUN=max), main = "What's the fattest those chickens get??")