Looking at interactions of continuous variables
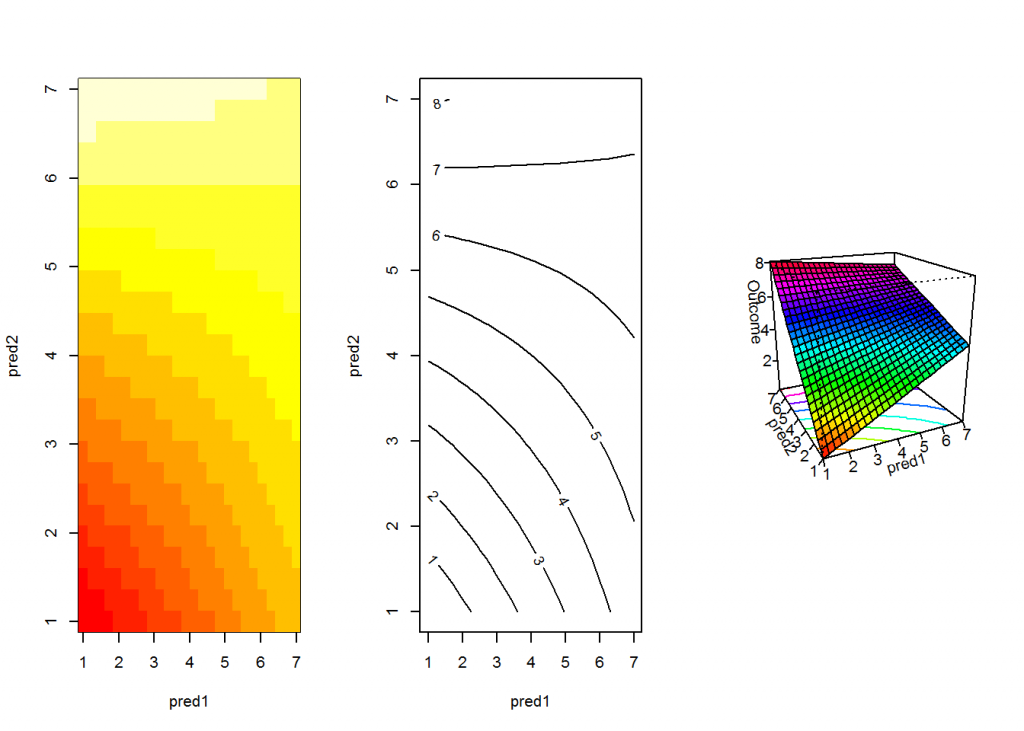
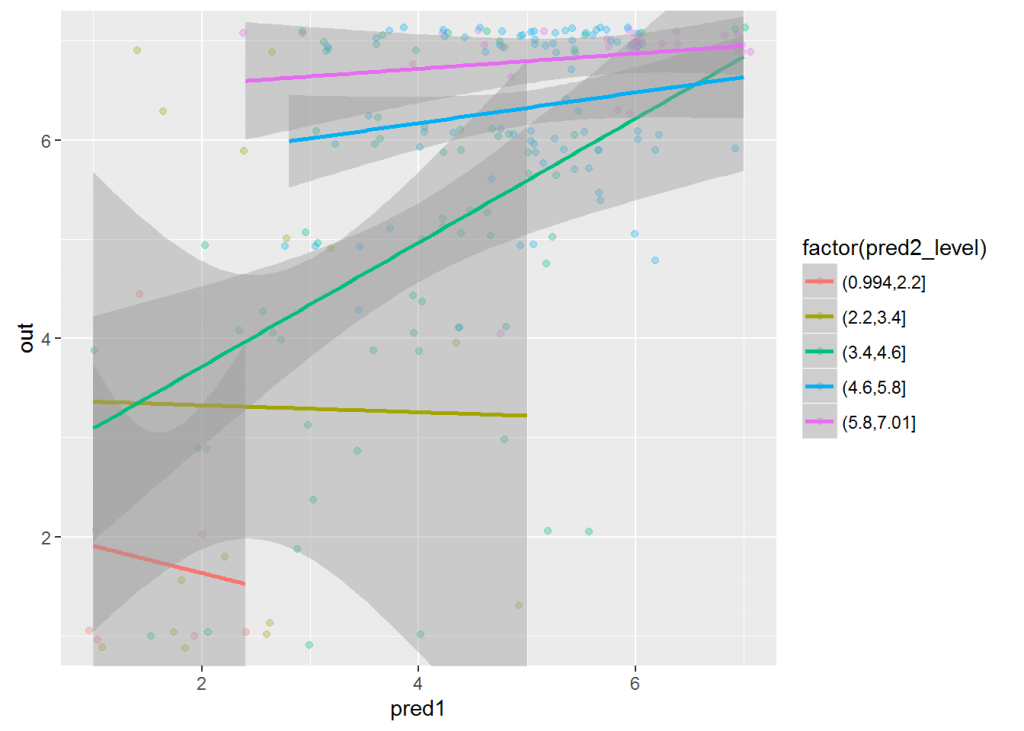
So we had an unexpected interaction effect between two continuous predictors in our dataset. I thought it was some kind of ceiling effect so I did some plots to see what was causing it. I still think it’s a ceiling effect, but I also found it interesting that the effect of predictor 1 is only really present at average levels of predictor 2. Anyway, I’ve attached my code. If you have an interaction that you can’t quite understand, these plots may help: http://rpubs.com/abcharlton/interaction-plots.