GH LADYBUG 1.0 LAB NOTES:
Topics To Cover:
- Downloading Ladybug
- Getting started
- Components
Hello Everyone, welcome to Ladybug 1.0!
Below is everything you will need to know to start using Ladybug for climate analysis.
Download Ladybug:
- To download Ladybug, visit food4rhino.com.
- Download the most recent version of Ladybug. You may have to create an account if you don’t have an account already
- Open Grasshopper.
- Then, click on File –> Special Folders –> Component Folders. Copy and paste all the Ladybug files you had previously downloaded into this folder.
- Close Rhino and Grasshopper and reopen. You should see Ladybug appear along the top of the component toolbar.
- Check out this tutorial if you have any trouble.
Getting Started:
- To start, open Grasshopper by typing “Grasshopper” in the Rhino command line or by clicking on the Grasshopper icon in the Rhino toolbar. A new window will appear once Grasshopper is open.
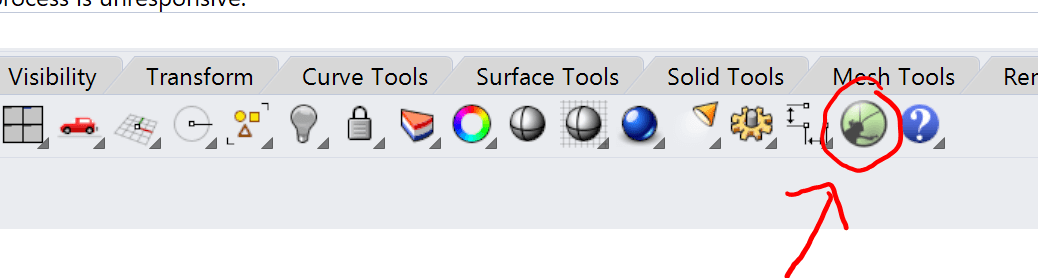
- Click on Ladybug at the top of the toolbar. You will know if Ladybug is installed correctly if it appears in the toolbar. If it does not appear, refer to the “Download Ladybug” section above.

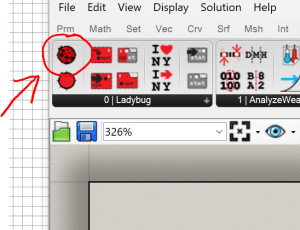
- To start using Ladybug, navigate to the component toolbar section 0 | Ladybug on the lefthand side. Click on the red circle with black dots in the upper lefthand corner. If you hover over the icon with your mouse it should say Ladybug_Ladybug. Click and drag into tan workspace below. Note: You will need to run this component every time you use Ladybug.

- To check and see of Ladybug is working, hover over the component and a dialogue box should appear saying Ladybug is flying!!! If you see this message you are good to go! If not, you may need to update Ladybug.
- The next step is to open a .epw weather file for the components to reference. To do this, first, download a .epw file for the location you are looking for. You can find .epw file using climate.onebuilding or EnergyPlus. If no .epw file exists for your location choose the closest available location to the location you are looking for. The process for acquiring the .epw file differs slightly between climate.onebuilding and EnergyPlus. See the note at the end of this section fo the steps you need to take to download the .epw file per website.
- The next step is to add a component to read the weather data from the .epw file. There are two ways this can be done. If you downloaded the weather file see Steps 7-8. If you copied the link address skip to Steps 9-10.
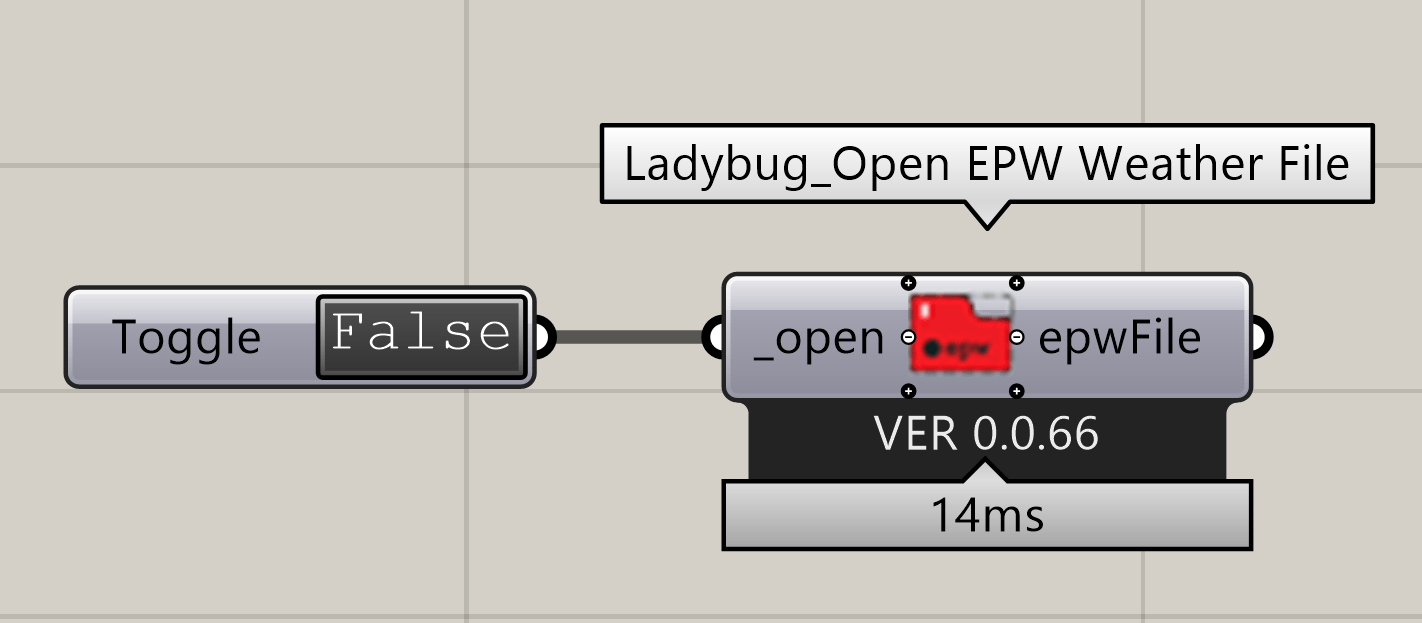
- Double-click in the workspace and type “open” in the search bar and click on Ladybug_Open EPW Weather File. Next, double-click in the workspace and type “toggle” in the search bar and click on Boolean Toggle. Click and drag the component to the left of the Ladybug_Open EPW Weather file component.
- Connect the Boolean Toggle to the “open” input of the Ladybug_Open EPW Weather file component. Next, double-click on the Boolean Toggle. A window should appear where you can locate your saved .epw file. Notice: the Boolean Toggle change from False to True. In order for the data to be read by subsequent components, Boolean Toggle must read True. Double-clicking on Boolean Toggle will switch it back to False.
- Double-click in the workspace and type “panel” in the search bar. Double-click in the panel and paste the link you copied from EnergyPlus.

- Next, double-click in the workspace and type “open” and click on Ladybug_Open EPW And STAT Weather Files. Connect the Panel to the”_weatherFileURL” input of the Ladybug_Open EPW And STAT Weather File component.
- Double-click in the workspace and type “import epw” in the search bar and click on Ladybug_Import epw.

- Connect the “epwFile” output from Ladybug_Open EPW Weather file or from Ladybug_Open EPW And STAT Weather File into the “_epwFile” input of the Ladybug_Import epw component. From here, you are ready to connect the required data as required by the various climate analysis components.


Steps to download .epw files per website:
Climate.onebuilding:
- Navigate to the location you want.
- Click on the link to download the data. Note: If available, chose the file that is a TMYx.2004-2018 file type as that has the most recent weather data.

- Extract the data from the .zip folder and save to your computer.

EnergyPlus
- Navigate to the location you want.
- Click on Download All to download the data or you can right-click on Download All –>Copy link address.

- If you download the weather data, extract the data from the .zip folder, and save to your computer.

Ladybug Component Basics
Check out this tutorial for more information about how to use each component.
- Analysis Period – this component is useful for identifying the specific time period in which you want to conduct your analysis. Utilizing this component you can analyze the solar radiation on your building for the month of July or during the winter months instead of analyzing the entire year, which Ladybug defaults to. Click here for a description of the component’s icon, inputs, and outputs.

- 3D Charts – this component graphically represents climate data or hourly simulation data. This is component is useful for creating a graphic that captures a holistic understanding of a specific location’s climate. Click here for a description of the component’s icon, inputs, and outputs.


- Windrose – this component creates a graphic to assist with understanding the direction and magnitude of wind for a given location. This information can help inform where operable windows could be placed on your building for passive cooling strategies or where you may need to block the wind for other reasons. Click here for a description of the component’s icon, inputs, and outputs.


- Sunpath – this component is used to find the position of the sun in the sky throughout the year for a specific location. This analysis could be paired with a shade analysis to see the impact of shadows cast by your building and surrounding objects (e.g. other buildings, trees, etc.) Click here for a description of the component’s icon, inputs, and outputs.


- Solar Radiation – this component is used to analyze the amount of solar radiation that your building may be subjected to throughout the course of a year and a specific time period. This tool can help inform design questions such as where shading devices should be placed or if a roof plane is adequate for solar panels and how changes in these areas can improve the performance of your building design. Click here for a description of the component’s icon, inputs, and outputs.


- Psychrometric Chart – this component graphically represents the “comfort zone” for a given location based on dry bulb and wet bulb temperatures and relative humidity. Understanding this information can inform how you design the enclosure of your building or the temperature range you want to maintain for occupant comfort. Click here for a description of the component’s icon, inputs, and outputs.


