
Mid-term Outline
Please see the post for Salvador Rueda’s BCNecologia_Presentacio Superilles definition and the J. of Urbanism submission, ACADIA 2015 and ACSA 2016.
*Example from Speranza Architecture + Urban Design.
PAGE 1
Project Concept or Site Image (quality of project, feeling, experience) full bleed
PAGE 2
Location Plan
- Location within City of Eugene (ex. RCR, Aldayjover) satellite with editing or line drawing (Imagetrace)
PAGE 3
Project Description, 1-3 paragraphs
- Genis Loci (being of place) (and counter argument by Lateral Office) + Problems of a place
Project Objectives, 2-4 goals
- Describe each objects in a sentence and images (either thumbnails or full bleed), images should preferably relate to site (immediate or town) or zoomed in atmospheric condition
PAGE 4
INTRODUCTION: Context, Problem and Purpose
- Title: Two-word title
- Purpose Sentences as typed paragraph: What is the problem, how is it applied to atmosphere + design at the scales of both the downtown Eugene (4 by 4 block area) and Kesey Square, combining social and natural phenomena? Who is affected (be as specific as possible); Why is it important, including social value? (highlight key words)
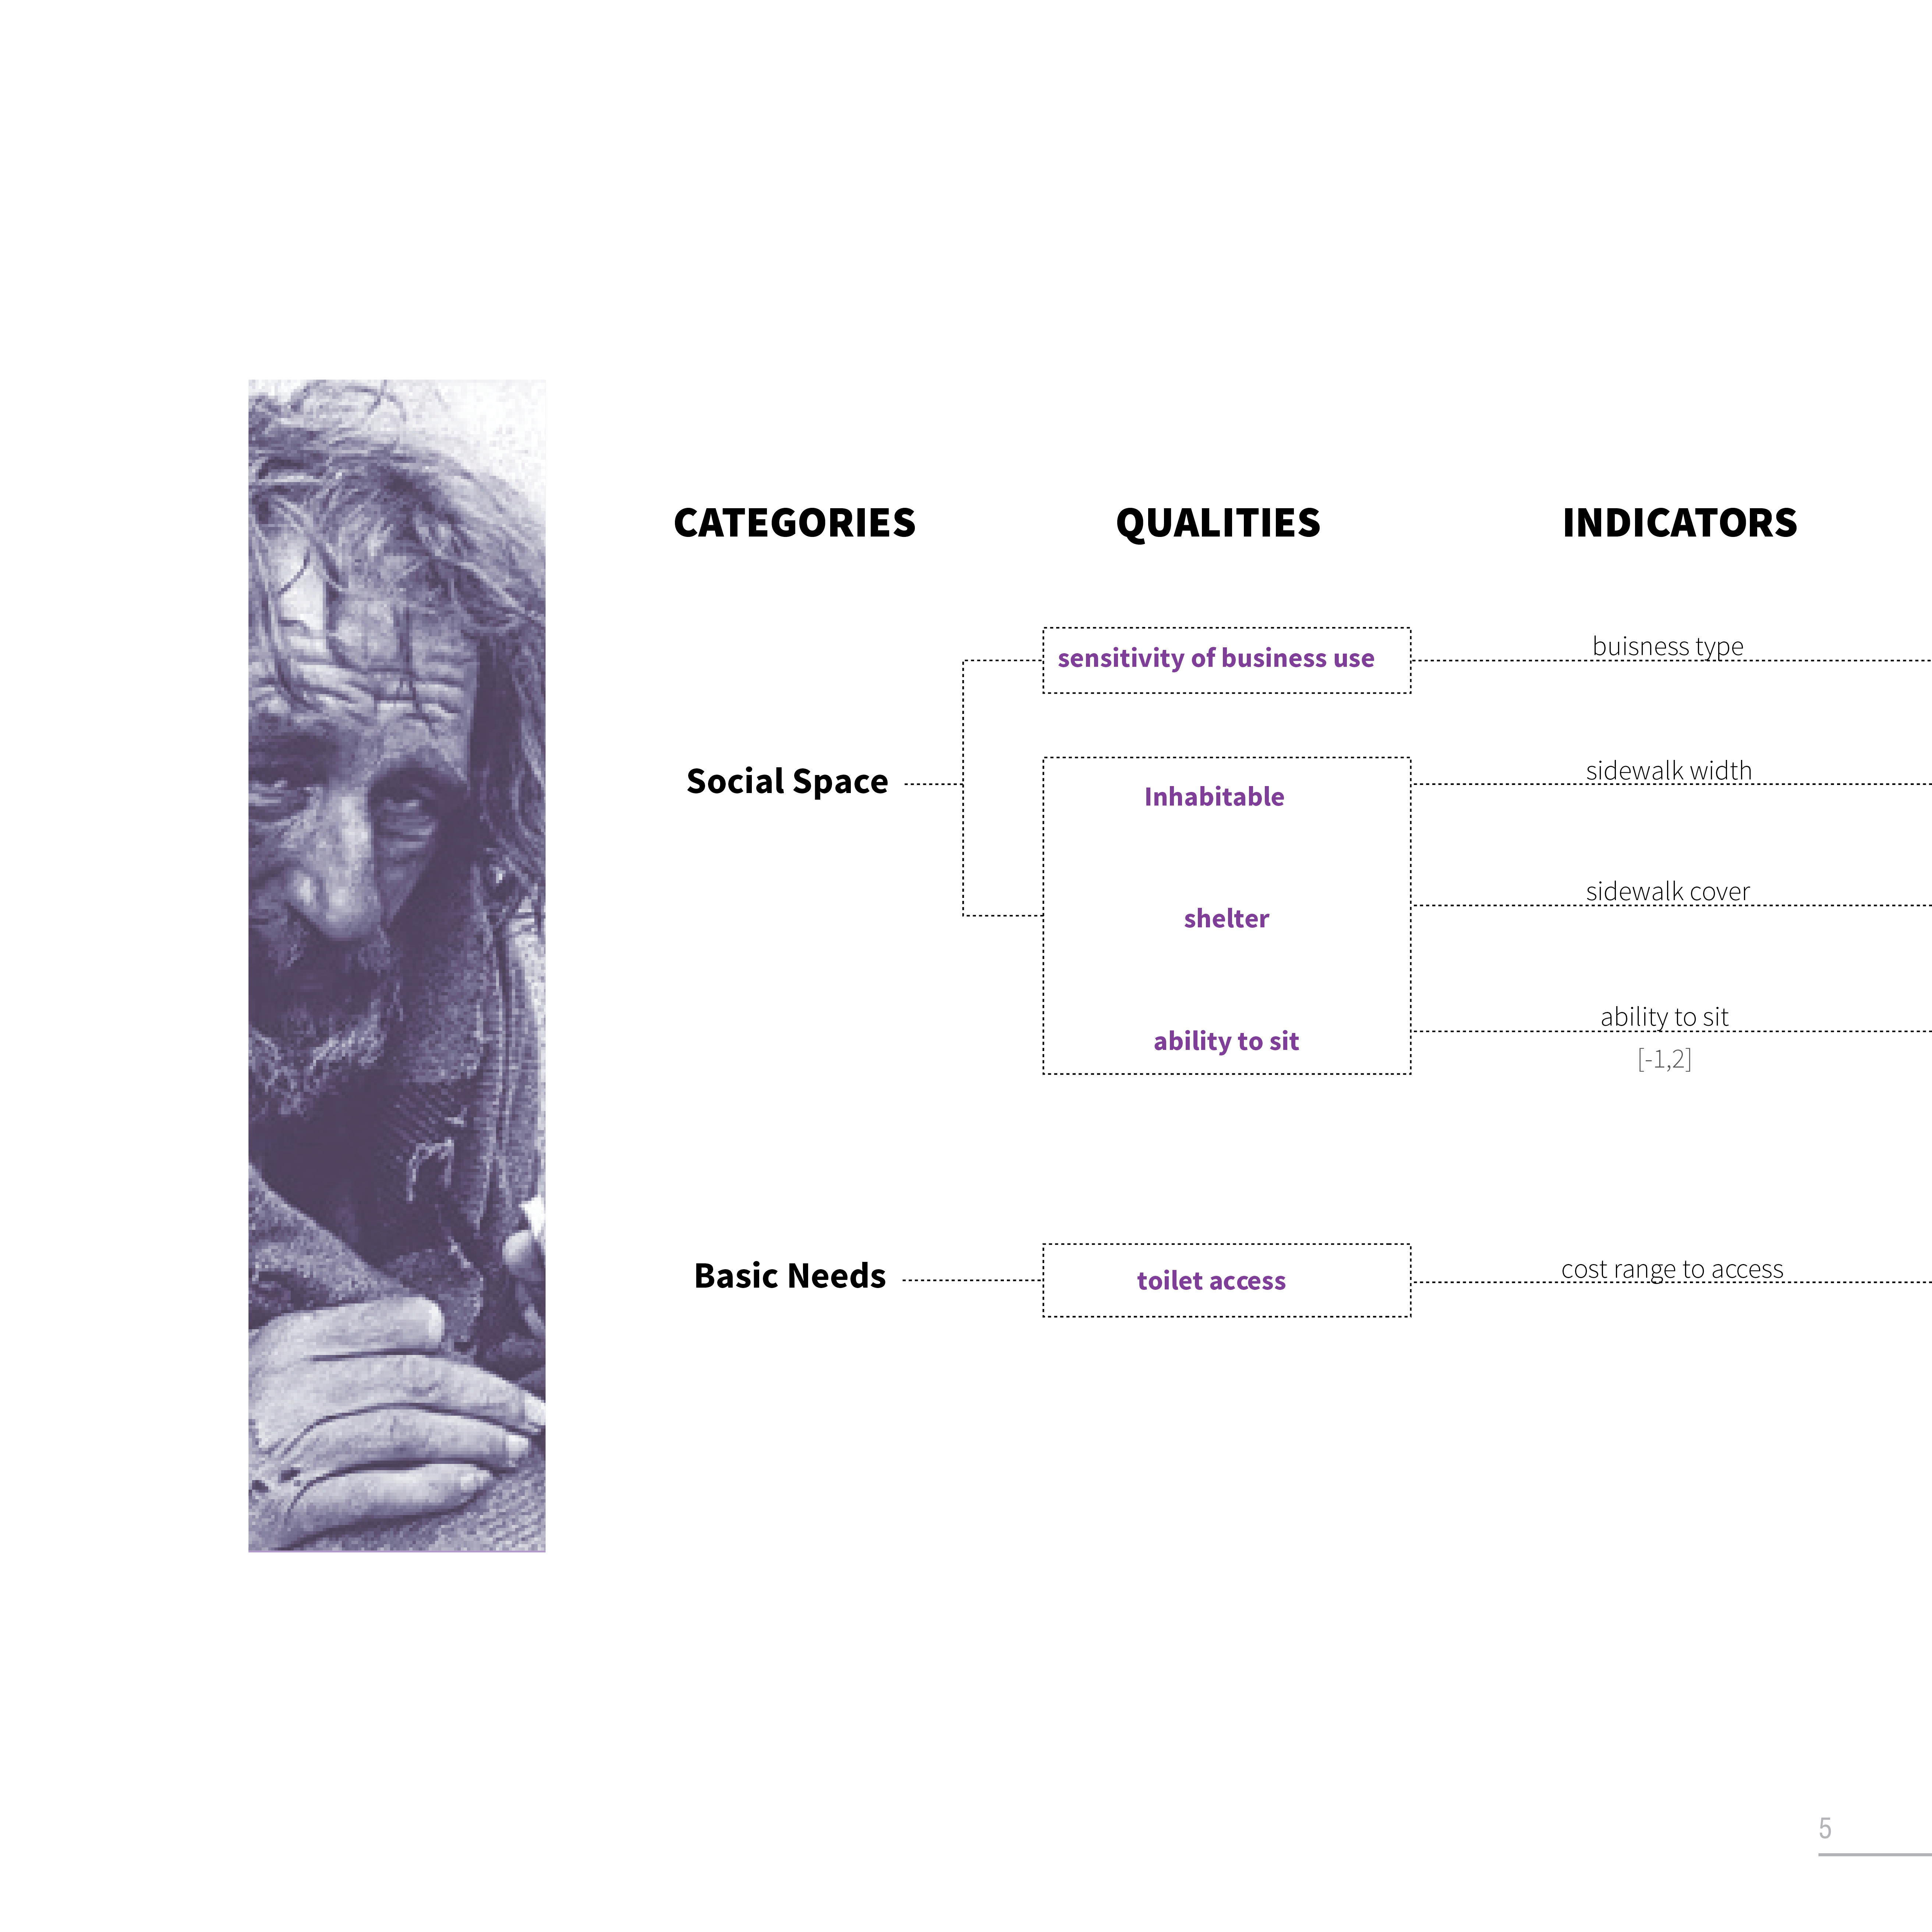
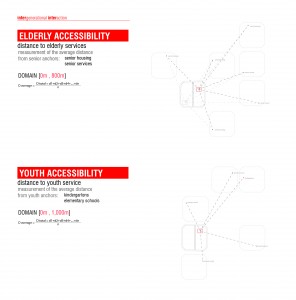
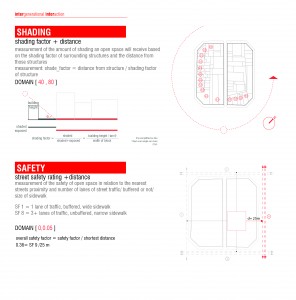
- Your Theoretical Framework: From each Primary category choose a secondary category. List qualities (processes) and indicate with a symbol if it is a fixed urban quality or an urban phenomena (human or natural)? Consider 1 indicator for each.
- Choose 1-2 geometry inputs? (parcel area, height, sidewalk width, rail, bike, waterway) Hint: see OSM/ELK. This will lead to unit diagrams at GPS data point locations.
- Small thumbnail pictures and/or narrow texture of swatch of qualitative image/material perhaps hinting at final output. Graphic hints: set the tone for the unit and highlight color here

PAGE 5-6
BACKGROUND: Context
- Outline: Diagram and or Google Sheet of Purpose / Primary and Secondary categories / Qualities / Indicators (history) / On-site or Off-Site / Fixed or Phenomena
- Theoretical references: Writing reference (Kiel Moe, Philippe Rahm, Inaki Abalos and Lacaton Vassal)
- Eugene problems: 1- 3 recent articles as quotations or informational statistics, and policy (Register Guard, Daily Emerald, other) (FYI, City Eugene, State of Oregon, USA, international protocol)
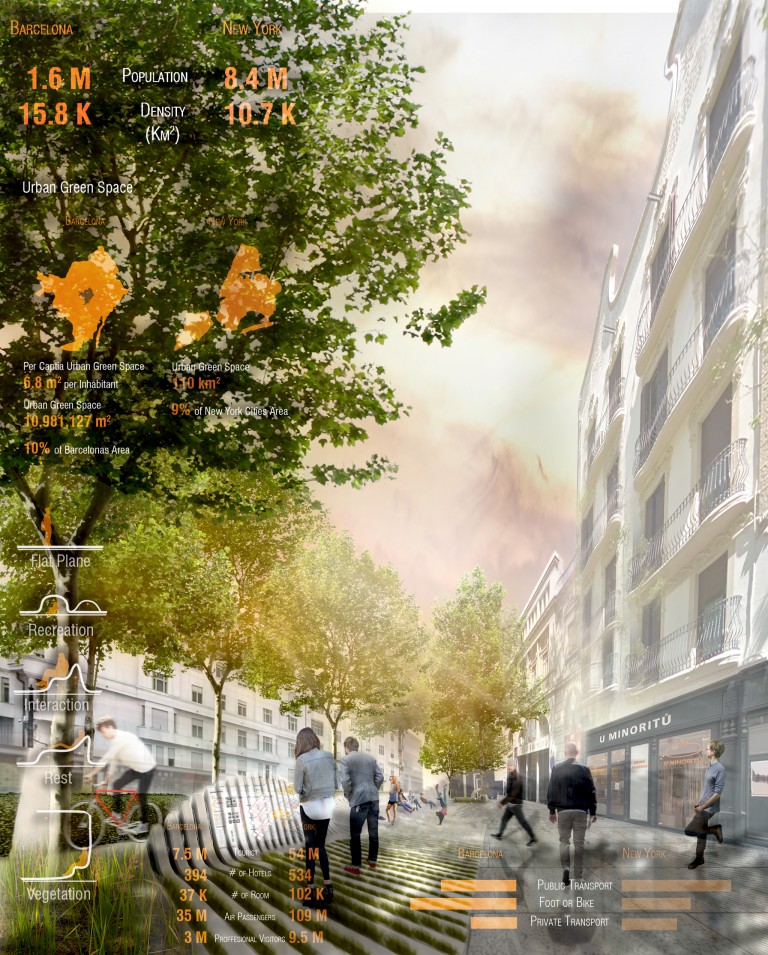
- Comparative Statistics: Infographics to set a quantitative baseline big picture to small picture indicators to follow
BACKGROUND: Quantitative and Qualitative Baseline (statistics and info-graphics)
- Qualitative media: picture (zoomed in) of your urban design characteristics (criteria)
- Abstract scientific data: measurement of basic relationships, statistics related to measure quality (ex. 6:1 water to urban farming recommendation). Abstract and Baseline models. Ex. Cost of water Barcelona / Granada. Ex. Overnight temperature difference, humidity, income per capita, etc.
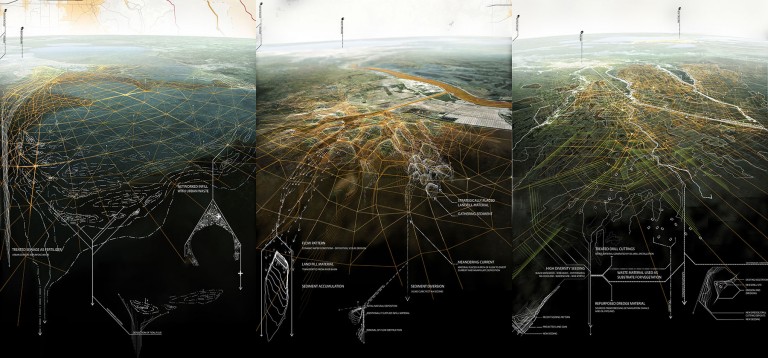
- Planning Diagrams: visualize/organize relationships of your ideas in degrees of time, material, space and real-time data
- Ecology: Bar charts and graphs may also be helpful, especially for quantitative contextualization and possibly comparison.
- Timeline: Identify time relevance in periods (daily, weekly, seasonally, annually, multi-year) Seidman Residence, Corner Collage / Minard
- GH Plugins: What GH plugins would be helpful (show their icon)?
- Sensors (on-site): What sensors might be helpful? +Find online an example with script and prototype diagram. ++Inventory what you will need.
- Real-time Data (off-site): What databases exist?
- Ladybug EPW and Real-time Data (off-site): What databases exist?
PAGE 7-8
METHOD
Qualities and indicators, plus Icons and Thumbnail image of quality (zoom). Coding for data dictionary. (Quality – conditions)
Diagram Urban Characteristics + Indicators
- In-situ, 6-8 (indicators), Icons
- Off-Site, 2-4 at the small scale of our downtown test data point. Examples include: water collection, air pollution source, school, market, water source, etc.- found via municipal, digital, Yelp, Google), Icons
Downtown Eugene Study Area
(unit street and Superilla)
- Propose three options for Kessey Square and associated 3 x 3 superilles in Downtown Eugene.
- Exemplary Baseline Comparison area (The Whit, etc)
Landscape Catalog: Photograph and catalog materials and urban furniture (high and low). Indicate phenome / phenomena it supports using databases on individual Google Drive per student team. (See post to follow of presentation of landscape material cataloging, Speranza Architecture, Corner, McHarg, etc).
- organize by either 1) ideas or 2) trees, shrubs, grasses or pavements, urban furniture


* mapping workflow
Pages 9-10
METHOD
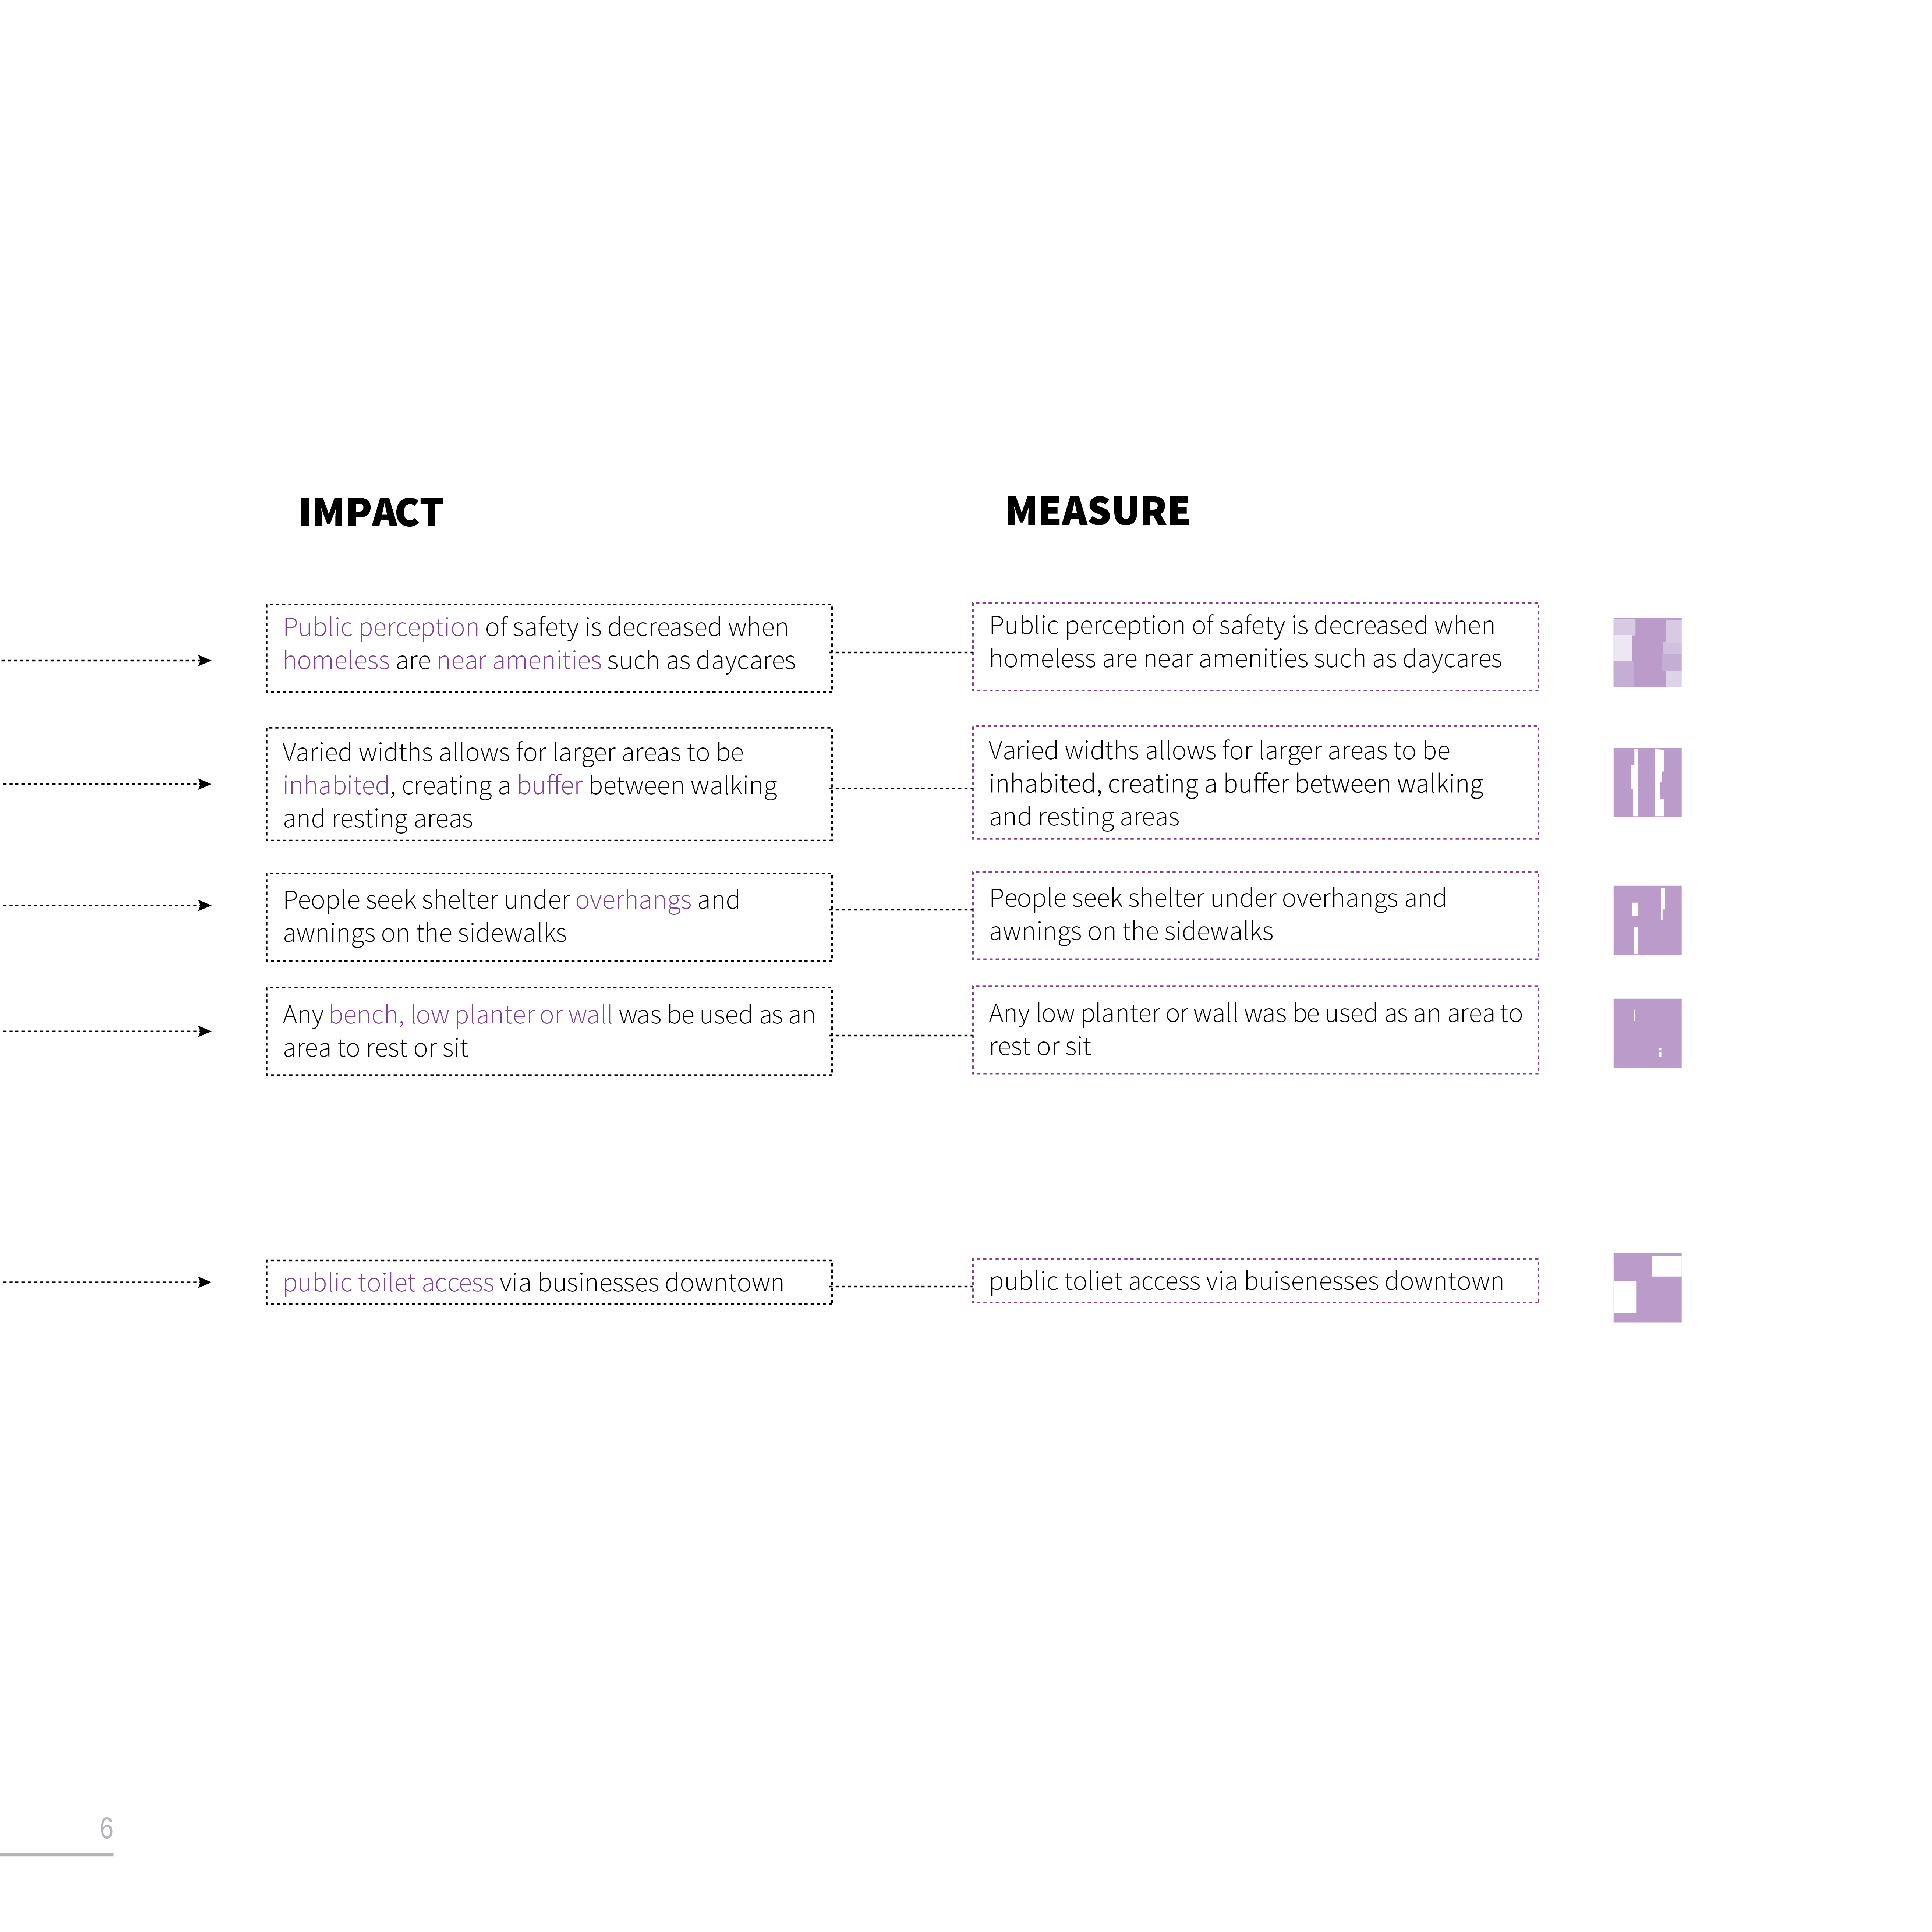
- Workflow Diagram : Categories, Qualities (evolution), Indicators, +Data Dictionary Descriptions, +Numerical Coding, Impact, Measurement, Thumbnail Diagram and or Icon.
.

Pages 11
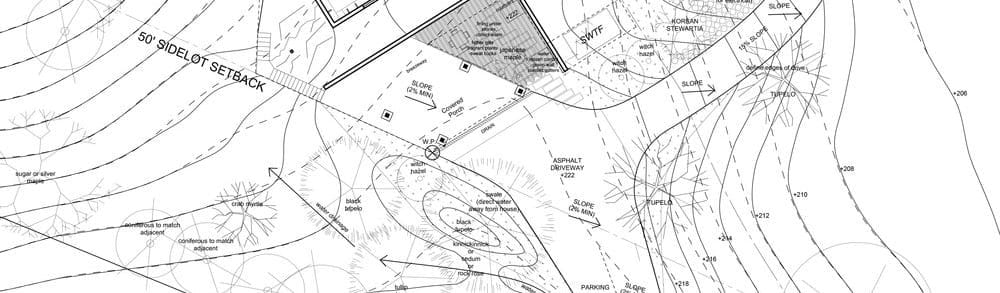
- Eugene Location Plan : locate your study area downtown Eugene (see Guallart ). Highlight your primary quality at the scale of the city.

(*control edges, consider raster background image at special areas in the neighborhood plan such as waterfront, green spaces or other spaces related to your Purpose Statement). Consider highlighting the Barcelona Superilla plan.
- Unit Module Diagram: Street / Intersection and Point Location at Sidewalk Unit (axonometric or plan) (Example, water catchment, air quality area, zoning use, street-level shop use, street trees, shrubs, running paths, exercise space, etc.)
Page 12
Individual Qualities / Indicators Layers: Unit Diagrams and Plan / Aerial / Axonometric
Page 13
- Parameter 1
- Parameter 2
Page 14
- Parameter 3
- Parameter 4
Page 15
- Parameter 5
- Parameter 6
Page 16
- Parameter 7
- Parameter 8
Page 17
Page 18
Baseline Comparison Area
- Data Collection and diagrams for Exemplary Baseline Comparison areas in Eugene and off-site in Urban Qualities locations
- Explain why important. Comparative circle diagrams and highlight differences with images and programming text.
Page 19 COMPOSITE DRAWING: compose various scales of previous drawings including downtown Eugene, street, point data sidewalk diagram, abstract diagrams, timelines, material swatches.
Page 20
***what did you learn from the analysis? What programming emerged? what fine-grained qualities emerged to design around (experience)?
Project Strategies, 2-4 strategies
- Describe each strategy in a sentence and images
Page 21
Program
- list and or images with label of projected program (ex. eat, sit, play)
Page 22
Thermodynamic Analysis
- copy from Wiki climate with reference
- comparison with other EPW location (usually airports)
- recommendations include temperature over year, humidity, cloud cover, wind speed and direction, high low temperature
- sun path and wind rose comparison, and human Comfort level (via Ladybug)


Page 23
Site Documentation, plan, section, axo/iso
- site plan with sunpath and contours (maybe) (downtown)
- wind roses summer and winter
- 3D view of site – initial 3D parti drawings (site proper) (ex. Studio Gang)
Page 24-26
Design Approaches with initial radiance analysis
- 3 studies with possible 3-4 variations, summer and winter for each, **highlight analysis (findings), you can “hide” temporal objects
Page 27-28
Ideas and Precedents
- Main image and title + 3-5 example images
Page 29-30
Design Schemes
- in scale
- thumbnail parti diagrammatic plan
Page 31-32 URBAN DESIGN INTERVENTION
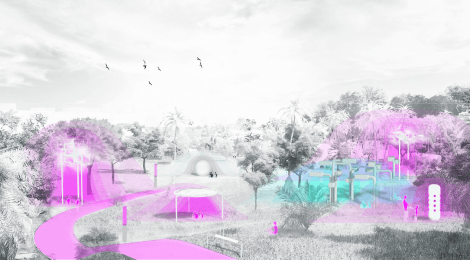
- Street Level Perspective of Human Experience: Initial surreal collage highlighting the urban phenomena
- Design Strategy Description: Findings from Sentence and or bullet points
- Measured Drawings: 2D plan, section, detail (see Jesus Arcos)


include data visualization…composite all drawings!
- Ladybug to location Sensor / Prototype small-scale spatial comparison: create a dataset (could be live data like 01b Diagramming); include Ladybug, GIS VIZ TOOL and your recorded data (SD, Xbee, other) presentation of mapping analysis image (z-line, circles, color blend) at the unit street / intersection and superilla; timeline; and physical situated technology design as kiosk (slab, post or other), lights in ground, etc.
- Dynamics: What is the timeline of the information update?
- Persona: Identify and describe users


