Respect your data – give & get credit

This is ‘Love Your Data‘ week, and each day we’ll be sharing a post about one or more fundamental data management practices that you can use. Part 4 of 5. Parts 1, 2, 3, 4, and 5

Data are becoming valued scholarly products instead of a byproduct of the research process. Federal funding agencies and publishers are encouraging, and sometimes requiring, researchers to share data that have been created with public funds. The benefit to researchers is that sharing your data can increase the impact of your work, lead to new collaborations or projects, enables verification of your published results, provides credit to you as the creator, and provides great resources for education and training. Data sharing also benefits the greater scientific community, funders,the public by encouraging scientific inquiry and debate, increases transparency, reduces the cost of duplicating data, and enables informed public policy.

There are many ways to comply with these requirements – talk to your local librarian to figure out how, where, and when to share your data.

GOOD PRACTICE

  • Share your data upon publication.
  • Share your data in an open, accessible, and machine readable format (e.g., csv vs. xlsx, odf vs. docx, etc.)
  • Deposit your data in a subject repository or our institutional repository so your colleagues can find and use it.
  • Deposit your data in the UO repository (Scholars’ Bank) to enable long term preservation.
  • License your data so people know what they can do with it.
  • Tell people how to cite your data.
  • When choosing a repository, ask about the support for tracking its use. Do they provide a handle or DOI? Can you see how many views and downloads? Is it indexed by Google, Google Scholar, the Data Citation Index?

THINGS TO AVOID

  • “Data available upon request” is NOT sharing the data.
  • Sharing data via PDF files.
  • Sharing raw data if the publication doesn’t provide sufficient detail to replicate your results.

TODAY’S ACTIVITY

Take the plunge and share some of your data today! Check out our information on data sharing, or the list of resources below, or contact us to get started.

If your data are not quite ready to go public, go check out the ones listed below under Resources, or this list of repositories and see what kinds of data are already being shared.

If you have used someone else’s data, make sure you are giving them credit. Check out our information on how to cite data, or look at these resources:

Tell Us

How was the deposit process? Easier or harder than you expected?
What do you need to do before you can share your data?
What do you like or dislike about the repository?
Are people sharing data that is similar to yours?

Twitter: #LYD16
Instagram: #LYD16
Facebook: #LYD16

Resources

See the guidelines on the UO Research Data Management pages
Contact us if you have questions.
Check out the resource board & the changing face of data on Pinterest

Posted in Data centers & repositories, Data citation, Licensing & permissions | Tagged | Leave a comment

Help Your Future Self – Write it Down!

This is ‘Love Your Data‘ week, and each day we’ll be sharing a post about one or more fundamental data management practices that you can use. Part 3 of 5. Parts 1, 2, 3, 4, and 5

(Click on picture to enlarge)

Lab_Bratz_Episode373

Think about your future self: Document, document, document! You probably won’t remember that weird thing that happened yesterday unless you write it down. Your documentation provides crucial context for your data. So whatever your preferred method of record keeping is, today is the day to make it a little bit better!

DATA DOCUMENTATION: GOOD PRACTICE

Data documentation or metadata is essential to sharing your data with other researchers or your future self.

One form of data documentation is a readme file. Here are some basic best practices (courtesy of Cornell University) for readme files:

  • Create one readme file for each data file, whenever possible. It is also appropriate to describe a “dataset” that has multiple, related, identically formatted files, or files that are logically grouped together for use (e.g. a collection of Matlab scripts). When appropriate, also describe the file structure that holds the related data files (see Example 2 in this PDF).
  • Name the readme so that it is easily associated with the data file(s) it describes.
  • Write your readme document as a plain text file, avoiding proprietary formats such as MS Word whenever possible. Format the readme document so it is easy to understand (e.g. separate important pieces of information with blank lines, rather than having all the information in one long paragraph).
  • Format multiple readme files identically. Present the information in the same order, using the same terminology.
  • Use standardized date formats. Suggested format: W3C/ISO 8601 date standard, which specifies the international standard notation of YYYYMMDD or YYYYMMDDThhmmss.
  • Follow the conventions for your discipline for taxonomic, geospatial and geologic names and keywords. Whenever possible, use terms from standardized taxonomies and vocabularies.

Today’s Activity:

Using the guidelines and examples in Cornell’s pdf guide, write your own readme file and share it:

Twitter: #LYD16
Instagram: #LYD16
Facebook: #LYD16

Resources

Check out the resource board & the changing face of data on Pinterest
Talk to us if you have questions

Source: materials adapted from LYD website.

Posted in News | Leave a comment

It’s the 21st Century — Do you know where your data is?

This is ‘Love Your Data‘ week, and each day we’ll be sharing a post about one or more fundamental data management practices that you can use. Part 2 of 5. Parts 1, 2, 3, 4, and 5
 

GOOD PRACTICE

Have a plan for organizing your data. This usually includes a folder structure and file naming scheme (plan), and version control to keep track of file changes. Make these a part of your research process and they will become good habits. Check out the tips below!

You want to avoid this problem:phd052810s_storyInFileNames
Source: http://www.phdcomics.com/comics/archive.php?comicid=1323
want to see more? Google “bad file names” and browse through the images for laughs

TODAY’S ACTIVITY

File Naming: If you don’t already have a file naming plan and folder structure, come up with one and share it. See our list of good practices for naming files also summarized here:

  • Be Clear, Concise, Consistent, and Correct
  • Make it meaningful (to you and anyone else who is working on the project)
  • Provide context so it will still be a unique file and people will be able to recognize what it is if moved to another location.
  • For sequential numbering, use leading zeros.
    • For example, a sequence of 1-10 should be numbered 01-10; a sequence of 1-100 should be numbered 001-010-100.
  • Do not use special characters: & , * % # ; * ( ) ! @$ ^ ~ ‘ { } [ ] ? < >
    • Some people like to use a dash ( – ) to separate words
    • Others like to separate words by capitalizing the first letter of each (e.g., DST_FileNamingScheme_20151216)
  • Dates should be formatted like this: YYYYMMDD (e.g., 20150209)
    • Put dates at the beginning or the end of your files, not in the middle, to make it easy to sort files by name
      • OK: DST_FileNamingScheme_20151216
      • OK: 20151216_DST_FileNamingScheme
      • AVOID: DST_20151216_FileNamingScheme
  • Use only one period and before the file extension (e.g., name_paper.doc NOT name.paper.doc OR name_paper..doc)

File Version Control: Keeping track of versions of files, or file history, can be challenging but may save you a lot of time if you want to go back to an earlier version of a file. There are different ways to approach this issue:

  • Manually (low tech/no tech approach): Use a sequential numbered system: v01, v02
    • Don’t use confusing labels, such as ‘revision’, ‘final’, ‘final2’, etc.
  • Use version control software
    • If you use a cloud storage system, such as Spideroak, versioning might be built in/automatic
    • Git + Github may provide what you need but may also have a steep learning curve (but there are lots of educational resources, such as this and this, and there are also some GUI interfaces for Git if you’re not used to command-line work),  There are other systems too, such as Mercurial, or TortoiseSVN.

Folder Structure: Consider the hierarchy for how you want to organize your files, whether to use a deep or a shallow organization for them.

Here’s an example from the UK Data Archive :

Example of folder structure from UK Data Archive.

Example of folder structure from UK Data Archive.

Tell Us

How do you name your files? Do you have a system? Is it written down?
Would you change anything about it now, if you could?
What tools do you use to keep your files organized?

Twitter: #LYD16
Instagram: #LYD16
Facebook: #LYD16

Resources

See the guidelines on the UO Research Data Management pages
Contact us if you have questions.
Check out the resource board & the changing face of data on Pinterest

Source: materials adapted from LYD website.

Posted in File management | Tagged | Leave a comment

Love Your Data (LYD) week – Keep your data safe

This is ‘Love Your Data‘ week, and each day we’ll be sharing a post about one or more fundamental data management practices that you can use. Part 1 of 5. Parts 1, 2, 3, 4, and 5

GOOD PRACTICE

Follow the 3-2-1 Rule:

  • Keep 3 copies of any important file (1 primary, 2 backup copies)
  • Store files on at least 2 different media types (e.g., 1 copy on an internal hard drive and a second in your department or college’s server, or secure cloud storage)
  • Keep at least 1 copy offsite (i.e., not at your home or in the campus lab — check with your department or college about offsite or secure cloud storage)

If possible, it is highly recommended that you set up an automated system to back up your files. This is true whether you work alone, or as part of a research team. For example, use Syncthing.

Avoid these: 

  • Storing the only copy of your data on your laptop or flash drive
  • Storing critical data on an unencrypted laptop or flash drive
  • Saving copies of your files haphazardly across 3 or 4 places
  • Sharing the password to your laptop or cloud storage account

Today’s activity

Data snapshots or data locks are great for tracking your data from collection through analysis and write up. Librarians call this provenance, and it can be really important.

Errors are inevitable. Data snapshots can save you lots of time when you make a mistake in cleaning or coding your data. Taking periodic snapshots of your data, especially before the next phase begins (collection or processing or analysis) can keep you from losing crucial data and time if you need to make corrections. These snapshots then get archived somewhere safe (not where you store active files) just in case you need them. If something should go wrong, copy the files you need back to your active storage location, keeping the original snapshot in your archival location. For a 5-year longitudinal study, you might take snapshots every quarter. If you will be collecting all the data for your study in a 2-week period, you will want to take snapshots more often, probably every day. How much data can you afford to lose?

Oh, and (almost) always keep the raw data! The only time when you might not is it’s easier and less expensive to recreate the data than keep it around.

Instructions: Draw a quick workflow diagram of the data lifecycle for your project (check out our examples on Instagram and Pinterest). Think about when major data transformations happen in your workflow. Taking a snapshot of your data just before and after the transformation can save you from heartache and confusion if something goes wrong.

Tell us 

Where do you store your data? Why did you choose those platform(s), locations, or devices?

Twitter: #LYD16
Instagram: #LYD16
Facebook: #LYD16

Resources

See the guidelines on the UO Research Data Management pages
Contact us if you have questions
Check out the resource board & the changing face of data on Pinterest

Source for this page: LYD website.

Posted in Storage and backup | Tagged | Leave a comment

ORCiD: Credit Where Credit is Due

What is ORCID?

The Open Researcher and Contributor ID (ORCID) is a permanent digital identification number associated with a given researcher. This identifier enables you to create an openly accessible profile for yourself that can be associated with and linked to your research activities and outputs, from grants, to articles, datasets, and citations. ORCID is an open, non-profit, community-driven effort to create and maintain a registry of unique researcher identifiers that can be tracked across publishers and institutions.

Benefits of ORCID

You can associate your ORCID number with all of your publications, data sets, grants, and even presentations to ensure that your work is uniquely identified. This alleviates confusion and helps you distinguish your research activities from others. It ensures proper attribution in cases where:

  • You have a common name
  • You have changed your name, or published under slight variations of your name (following a marriage or John Doe vs. John A. Doe, e.g.)
  • You change institutions

A single common identifier makes it easier to find and cite your work in article databases and indexes, and through search engines such as Google Scholar. It also enables the automatic connection between systems.

As more journals and funders begin requesting and using ORCIDs, it can be a huge time saver as it has the option to automatically import your information, such as basic contact, awards and works, to these applications. See this Integration chart to find out which organizations are implementing connections with ORCID.

Some examples of ways to integrate your existing profile with ORCID:

Registering with ORCID

Registering with ORCID is fairly straightforward. Once you register, you can begin to connect other details for your record by linking to other identifiers, publications, grants, etc. You can adjust the privacy settings for the information stored in ORCiD at any time.

Questions about ORCID? Contact: Brian Westra

Graduate Students: Submitting your Thesis or Dissertation?

ProQuest, the site used by the University of Oregon to administer the submission of electronic theses and dissertations (ETDs), has begun tracking ORCID numbers. Associating a universal identifier with your work early in your career will ensure that it is always correctly attributed.

Questions about ORCID and ETDs? Contact: Catherine Flynn-Purvis

Posted in Data citation, News | Leave a comment

NCBI and the NIH Public Access Policy

From the HLIB-NW email list:

Recording Available: NCBI and the NIH Public Access Policy

On March 5, NCBI hosted a full-to-capacity webinar outlining the NIH Public Access Policy, NIHMS and PubMed Central (PMC) submissions, creating My NCBI accounts, use of My Bibliography to report compliance to eRA Commons, and using SciENcv to create biosketches.  The slides and Q & A are available on the NCBI FTP site (http://1.usa.gov/1BUTIHM). The March 5 recording is available on the NCBI You Tube channel.

A live re-broadcast of the webinar will be held on April 21, 2015.

Posted in News | Tagged , , , | Leave a comment

Thoughts on Data and Ethics, and Resources for Psychology

Thoughts on Data Management and Data Ethics

Earlier this year, Brian Westra and I gave a brief presentation on Data Management issues in an annual seminar that the Department of Psychology holds for its first-year graduate students. The seminar’s larger topic was data ethics. One question that came up was how data management and data ethics relate to one another.

This post has two parts:

1) A few points on how data management and ethics relate. It can be useful to think about this topic explicitly because discussions about it can help to guide research and data management decisions.

2) A list of resources on these topics for new graduate students. Some of the links relate specifically to Psychology, but they all apply in principle across disciplines.

Short version: Data ethics is built on data management. Both are more about one’s frame of mind than about any specific tools one chooses to use. Having said that, it’s important to give oneself exposure to ideas and tools around these topics, in order to push one’s own thinking forward. Some useful resources are listed below to help you get started.

Thoughts on Data Management and Ethics

  • Data ethics is built on data management.Ethical questions and potential problems come up based on data management decisions made in the past, down to topics as seemingly trivial as where data are stored (on a passwordless thumb drive? Or in a place where disgruntled employees or Research Assistants can access or abscond with them?), to what data are even kept (it’s hard to re-use something, for good or ill, if you didn’t record it in the first place).

    This doesn’t just apply to ethically problematic topics, though. Things that may look like bad ideas at first (such as the ability of RAs to remove data from the lab) may not be in certain situations, just as ideas that seem good at first may come to seem bad later. The larger point is that ethical questions about both legitimate and illegitimate uses of research data need to be considered and addressed as they come up, and that DM decisions can help one to predict which questions are more likely than others to come up during the data lifecycle.

  • Talking about both data management and ethics is more than talking about tools.Because data ethics questions come up based on data management decisions, it is true that discussions about data ethics sometimes require at least some minimum level of technical understanding. Basic technical knowledge here can help to answer questions beyond whether certain data should be kept or not, such as which ways of storing and offering access to those data would be acceptable. This basic technical knowledge is important for many ethical discussions, because it can help to shape the conversation to more nuanced topics.

    Rather than the take-home message here being that lacking some amount of technical understanding means that one shouldn’t engage in conversations about data ethics, I think that making education on these topics easily accessible (here at the UO, for instance, through our own DM workshops, workshops from the College of Arts and Sciences Scientific Programming office, and resources such as the Digital Scholarship Center) is important and necessary, as is taking advantage of them.

  • Data Management (and, thus, data ethics) is about having a certain frame of mind, even at a superficial level.Data Management often has to do with thinking about decisions up-front rather than in a reactionary way. This frame of mind can also apply to talking about data ethics. Even if some ethical issues haven’t come up yet, having good DM in place can help one to more quickly understand and respond to new issues that do come up.

Resources for New Students (especially in Psychology)


Issues of data management are not going away; indeed, their relevance to individual researchers will likely increase — the White House, for example, recently issued new guidelines requiring Data Management Plans (and encouraging data sharing) for all federal grant-funded research. Below is a list of resources to prompt further thought and discussion among new grad students.

These are listed here with a focus on Psychology; having said that, many of them have relevance beyond the social sciences:

  • A useful summary of tools that are available for graduate students to organize their work (including data), from Kieran Healy, a Sociologist at Duke University.
  • An overview of the new “pre-registration” movement in Psychology: “Pre-registration” is when researchers register their hypotheses and methods before gathering any data. In addition to increasing transparency around research projects, this practice can increase how believable results seem, since it can decrease researchers’ incentives to go “fishing” for results in the data. This practice could also presumably be used to build a culture in which all aspects of a project, from methods to data, are shared.
  • Especially relevant for social scientists, a nice summary of several cases that deal with data management and the de-identification of data:
    • A summary of several cases in which de-identified data were able to be re-identified by other researchers, from the Electronic Privacy Information Center (EPIC)
    • A more nuanced, conceptual reply to (and criticism of) focusing on cases such as those in the summary above from EPIC. A take-home message from these readings is that data can sometimes be re-identified in very creative ways not immediately apparent to researchers. Other sites, such as this page from the American Statistical Association, summarize techniques that can be used in order to share sensitive data. Of special note is that “sensitive data” could, if that information were re-identified, include not only medically-related records, but even answers to survey questions about morality or political affiliations.
  • For students at the UO: Sanjay Srivastava, Professor of Psychology, often includes commentary on data analysis and transparency issues on his blog, The Hardest Science.

Feel free to comment here or email Brian with questions about data management issues. Also take a look at our main website for more resources.

Posted in Workshops & Events | Leave a comment

Annotate, Annotate, Annotate

This post is part of a series on future-proofing your work (part 1, part 2). Today’s topic is annotating your work files.

Short version: Write a script to annotate your data files in your preferred data analysis program (SPSS and R are discussed as examples). This will let you save data in an open, future-proofed format, without losing labels and other extra information. Even just adding comments to your data files or writing up and annotating your analysis steps can help you and others in the future to figure out what you were doing. Making a “codebook” can also be a good way to accomplish this.


Annotating your files as insurance for the future…

Our goal today is simple: Make it easier to figure out what you were doing with your data, whether one week from now, or one month, or at any point down the road. Think of it this way: if you were hit by a bus and had to come back to your work much later, or have someone else take over for you, would your project come to a screeching halt? Would anyone even know where your data files are, what they represented, or how they were created? If you’re anxiously compiling a mental list of things that you would need to do for anyone else to even find your files, let alone interpret them, read on. I’m going to share a few tips for making this easier with a small amounts of effort.

In the examples below, I’ll be using .sav files for SPSS, a statistics program that’s widely used in my home discipline, Psychology. Even if you don’t use SPSS, though, the same principles should hold with any analysis program.

Annotating within Statistics Scripts:

Commenting Code

Following my post on open vs. closed formats, you likely know that data stored in open formats stand a better chance of being usable in the future. When you save a file in an open format, though, sometimes certain types of extra information get lost. The data themselves should be fine, but extra features, such as labels and other “metadata” (information about the data, such as who created the data file, when it was last modified, etc.), sometimes don’t get carried over.

We can get around this while at the same time making things more transparent to future investigators. One way to do this is to save the data in an open format, such as .csv, and then to save a second, auxiliary file, along with the data to carry that additional information.

Here’s an example:

SPSS Logo

SPSS is a popular data analysis program used in the social sciences and beyond. It also uses a proprietary file format, .sav. Thus, we’ll start here with an SPSS file, and move it into an open format.

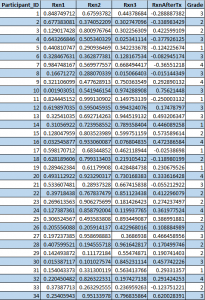
SPSS has a data window much like any spreadsheet program. Let’s say that a collaborator has given you some data that look like this:

Example_Data_View

Example Data

Straightforward so far? The data don’t look too complicated: 34 participants (perhaps for a Psychology study), with five variables recorded about each of them. But what does “Rxn1,” the heading of the second variable in the picture, mean? What about “Rxn2?” Does a Grade of “2” mean that the participant is in 2nd grade in school, or that the participant is second-rate in some sport, or something else?

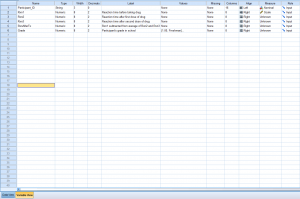
“Ah, but I’ve thought ahead!” your collaborator says smugly. “Look at the ‘Variable’ view in SPSS!” And so we shall:

SPSS_Example_Variable_View

Example SPSS Variable View

SPSS has a “variable” view that shows metadata about each variable. We can see a better description of what each variable comprises in the “Label” column — “Rxn1,” we can now understand, is a participant’s reaction time on some activity before taking a drug. Your collaborator has even noted in the label for the opaquely-named “RxnAfterTx” variable how that variable was calculated. In addition, if we were to click on the “Values” cell for the “Grade” variable, we would see that 1=Freshman, 2=Sophomore, and so on.

It would have been hard to guess these things from only the short variable names in the dataset. If we want to save the dataset as a .csv file (which is a more open format), one of the drawbacks is that the information from this second screen will be lost. In order to get around that, we can create a new plain-text file that contains commands for SPSS. This file can be saved alongside the .csv data file, and can carry all of that extra metadata information.

In SPSS, comments can be added to scripts in three ways, following this guide (quoted here):

COMMENT This is a comment and will not be executed.

* This is a comment and will continue to be a comment until the terminating period.

/* This is a comment and will continue to be a comment until the terminating asterisk-slash */

We can use comments to add explanations to our new file as we add commands to it. This will actually allows us to add more than the original SPSS file would have held, since we can now have labels as well as the rationale behind them, in the form of comments.

Now able to write comments, we can write and annotate a data-labeling script for SPSS like this:

/* Here you can make notes on your Analysis Plan, perhaps putting the date and your initials to let others know when you last updated things (JL, March 2014): */

/*
Perhaps here you might want to list your analysis goals, so that it’s clear to future readers:
1 Be able to figure out what I was doing.
2 Get interesting results.
*/

/* An explanation of what the code below is doing for anyone reading in the future: Re-label the variables in the dataset so that they match what’s in the example screenshot from earlier in this post: */

VARIABLE LABELS
Participant_ID “” /* The quotes here just mean that Participant_ID has a blank label */
Rxn1 “Reaction time before taking drug”
Rxn2 “Reaction time after first dose of drug”
Rxn3 “Reaction time after second dose of drug”
RxnAfterTx “Rxn1 subtracted from average of Rxn2 and Rxn3”
Grade “Participant’s grade in school”
EXECUTE. /* Tell SPSS to run the command */

/* Now let’s add the value labels to the Grade variable: */

VALUE LABELS
Grade /* For the Grade variable, we’ll define what each value (1, 2, 3, or 4) means. */
1 ‘Freshman’
2 ‘Sophomore’
3 ‘Junior’
4 ‘Senior’
EXECUTE. /* Tell SPSS to run the command. */

Now if we import a .csv version of the data file into SPSS and run the script above, SPSS will have all of the information that the .sav version of the file had.

While this is slightly more work than just saving in .sav format, by saving the data and the accompanying script in plain-text formats, we future-proof them for use by other researchers with other software (although researchers running other software won’t be able to directly run the script above, they will have access to your data and will be able to read through your script, allowing them to understand the steps you took). By saving using plain-text formats, we also make it easier to use more powerful tools, such as version control systems (about which I might write a future post).

By using comments in our scripts (whether they’re accompanying specific data files or not), we enable future readers to understand the rationale behind our analytic decisions. Every programming language can be expected to have a way to make comments. SPSS’ is given above. In R, you just need to add # in front of a comment. In MATLAB, either start a comment with % or use %{ and %} to enclose a block of text that you want to comment out. In whatever language you’re using, the documentation on how to add comments will likely be among the easiest to find.

Other Approaches:

Another, complimentary, approach to making data understandable in the future is to create a “codebook.” A codebook is a document that lists every variable in a dataset, as well as every level (“Freshman,” “Sophomore,” etc.) of each variable, and sometimes provides some summary statistics. It gives a printable summary of what every variable represents.

SPSS can generate codebooks automatically, using the CODEBOOK command. R can do the same, using, for example, the memisc package:

install.packages(‘memisc’)
library(‘memisc’)
?codebook() # Look at the example given in this help file to see how the memisc package allows adding labels to and generating codebooks from R dataframes.

We can also write a codebook manually, perhaps adding it as a block comment to the top of the annotation script. It might start with something like this:

/*

Codebook for this Example Dataset:

Variable Name: Participant_ID
Variable Label (or the wording of the survey question, etc.): Participant ID Number

Variable Name: Rxn1
Variable Label: Reaction time before taking drug
Variable Statistics:
Range: 0.18 to 0.89
Mean: .50
Number of Missing Values: 0

(etc.)

*/

Wrapping Up

The use of annotations can save you and your collaborators time in the future by making things clear in the present. In a way, annotating your files (be they data, or code, or summaries of data analysis steps) is a way to accumulate scientific karma. Use these tips to do a favor for future readers, looking forward to a time in the future when you might be treated to the relief of reading over a well-documented file.

Posted in News | Leave a comment

Saving Files for the Future

This is the second post in a series on future-proofing your work (part 1, part 3). Today’s topic is making a choice when clicking through the “Save As…” box in whatever program you use to do your work.

It pays to make sure that your files are saved in formats that you’ll be able to open in the future. This applies to data as well as manuscript drafts, especially if you often leave files untouched for months or years (e.g., while they’re being reviewed or are in press, but before anyone’s come along asking to see the data or for you to explain it).

Short version: “Open,” preferably plain-text file formats such as .csv, .txt, .R, etc., are better for long-term storage than “closed” formats such as .doc, .xls, .sav, etc. If in doubt, try to open a file in a plain-text editor such as Notepad or TextEdit — as a rule of thumb, if you can read the contents of the file in a program like that, you’re in good shape.


In general, digital files (from data to manuscript drafts) can be saved in two types of formats: open and closed.

  1. Open formats are those that
    a) can be opened anywhere, anytime, and/or
    b) have clear directions for how to build software to open them.A file saved in an open format could be saved in Excel but then just as easily be opened in Open Office Calc, SPSS, or even just a basic text editor such as Notepad or TextEdit. .txt, .R, .csv — if a file can be opened in a basic text editor (even if it’s hard to read when opened there), or has specifically been built to be openly understood by software developers (as with Open Office .odt, .ods, etc. files), you’re helping to future-proof your work.
  2. Closed or proprietary formats, on the other hand, require that you have a specific program to open them, or else reverse-engineer what that specific program is doing. SPSS .sav files, Photoshop .psd files, and, to some extent, Microsoft Office (.docx, .xlsx, etc.) files, among many others, are like this. How can you know if you’re using a proprietary file format? One rule of thumb is that if you try to open the file in a basic text editor and it looks like gibberish (not even recognizable characters), there’s a good chance that the file is in a closed format. This isn’t always the case, but it’s usually a good way to quickly check (1).

For an easy-to-reference table with file format recommendations, see our Data Management page on the topic.

It is important to note that, for example, even if R can read SPSS files, it doesn’t mean that SPSS files are “open.” They’re still closed, but have been reverse-engineered by the people who make R. SPSS, as a proprietary program using a proprietary file format, could change the format in its next version and break this reverse-engineering, or require that all users upgrade in order to open any files created in the new version.

So you’ve got a data file, and you’re willing to try out saving it in .csv format instead of .xlsx or .sav or whatever else your local proprietary vendor would suggest. Great! “But,” you say, “Will I lose any information when I re-save my data file? Will I lose labels? Will I lose analysis steps?” This, inquisitive reader, is an excellent question. In some cases, there is a trade-off between convenience now (using closed formats and some of the extra features they carry) vs. convenience later (finding that you can re-open a file that you created years ago with software that’s since upgraded versions or has stopped being developed).

In these types of cases, you could simply periodically save a copy of your files in an open format, and then keep on using the closed format that you’re more familiar with. Even doing something as simple as that could help you in the future. If you want to go a step further, however, read on in our next post, which will be published soon…

Posted in News | Leave a comment

Future-Proof as you go: Your future self will thank you

The fog over this beautiful mountainside obscures potential dangers. So it is with confusion and poorly-documented datasets.

This post introduces a series about ensuring that files for your projects will be usable in the future. Part 2 is on saving files for the future. Part 3 is on annotating statistics scripts and using data “codebooks.”

Perhaps everyone in the sciences has been there: the foggy expanse where questions abound and answers are only just at the tip-of-the-tongue, where innovation and discovery are halted and fed to a ravenous beast called Frustration. Yes, as you may recognize from my description, this is the mental space that results from reading the work of a collaborator or, worse yet, your own material, months or years after a project has finished, trying to remember what you possibly could have meant when you saved your data file with the name “Good_One_Look_at_This_2bFINAL_final.sav” among a dozen or more other files with names both similar and dissimilar (“Good_Look_at_This_early_Final_Final.sav”? I can hear, echoing through the fog, “It seemed like a good idea at the time!”).

And it’s not just filenames — this foggy place is also where files saved in old and now-unusable versions of Word or Excel go to die, as well as files that, if you can open them, have such questionably-descriptive variable names as “Sam1”.

Curses of our past selves are the number 1 export of this frustrating, foggy expanse. And so I am writing to remind you: Be kind to your future self, and to the future selves of your collaborators. Future-proof as you go.

What does future-proofing your work mean? We’ll explore a few easy practices in a short series of upcoming posts.

Future-proofing can mean embedding notes in your work to help you and others remember weeks to years down the road what you were doing. It can even extend to making a quick check of what format you’re saving a file in (yes, the choice that you make in the pop-up “Save As…” box in Excel between .csv and .xlsx can make a difference to your future self!). In a series of posts to follow, I’ll be walking through some small changes that you can consider making to your workflow now in order to make things easier for you and your collaborators in the future. Join me there. (Links will be added to the top of this post as new installments become available.)

Posted in News | Leave a comment