Sharing Knowledge – Portland Diagrams
The two methods stated in the readings both helped designers to understand and analysis a place or site in depth, by observing and recording what is on the site, a general understanding of the place could be obtained. I have used the method mentioned in McHarg’s “Design with Nature: A Step Forward” to analysis my chosen site, since I think this is a more scientific and accurate way to show the facts of the site, it also takes the site’s future, history and surroundings into account. By separating the information on different layer, there are more freedom to get the desire information from different combination of information layers, for instance, by stacking layers that contain flood plains, fault line and eroded soil information, the designers can get an idea what will happen and what should or should not be built on top of that area, and those areas that are overlapped will have a higher chance affected by natural disaster.
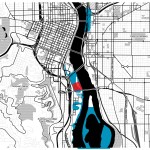
In my site analysis, I have divided the information into five layers, they are (1) Flood plain diagram that shows where the river level will be when there is heavy precipitation or a rise in global sea level, this is quite relevant since my site is located next to the river; (2) Transit diagram that indicates the locations of stations and public transit lines that pass near the site; (3) Building density diagram that shows the amount, density and sizes of man-made structures around the site; (4) The Elevation and landform diagram that shows the site’s location relative to different landforms around the area, as different geological factors may affect the site’s condition such as the direction of wind to the site, the amount of sunlight received, the level of landslide hazard or the drainage direction: and (5) The green space and historical area diagram that indicates open green spaces around the site, which could help designer to explore the possibility of connecting them.