
Z- LINE TOOL : RHINO + GRASSHOPPER & POST-PROCESSING
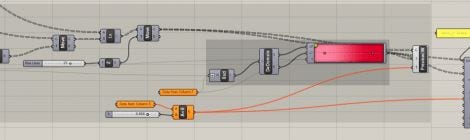
GRASSHOPPER SCRIPT
The Z-line tool can import up to three different data columns from the CSV, data is represented in LENGTH, COLOR, AND THICKNESS.
In the following image,
- Column D determines LENGTH
- Column E determines THICKNESS
- Column F determines COLOR GRADIENTS
NOTES: Component You Will Need
- [Unit Z] Unit vector parallel to the world {z} axis
- [Multiplication] Mathematical multiplication
- [Move] Move geometry in a direction
- [Slider] A range of numerical values
- [Line] Creates a line between two points
- [Bounds] Creates a numeric domain which encompasses a list of numbers
- [Deconstruct Domain] Deconstruct a numeric domain into its component parts
- [Gradient Control] Allows you to define a color gradient within a numeric domain. By default the unit domain (0.0 – 1.0) is used.
- [Custom Preview Line Weights] Custom preview with line-weights
- [Create Attributes]
- [Boolean Toggle] Boolean (true/false) toggle
- [Bake Geometry] Bake geometry to the document with specified attributes
- STEP 01: Create lines in the Z direction.
First take the Data from the Column D panel, plug output to [Unit Z] to give your data a z direction. Plug the output to input A of [Multiplication] and for input B use a grafted slider.
Second, The output of the [Multiplication] plug it to [Move] as the T input. For the G input, plug the [Location Points] given by the Longitude and Latitude. Plug the G output of [Move] and the [Location Points] to [Line]
For adding more length plug the output of [Line] to the G input of [Move] and for T input use a [Slider] plugged to [Unit Z].
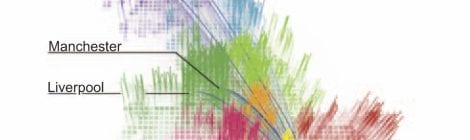
- STEP 02:Give the lines a Color Gradient.
Plug the Data from the Column F panel to [Bounds], plug the output to [Deconstruct Domain]. Plug the S output of [DeDomain] to the L0 input of [Gradient Control]. Plug the E output of [DeDomain] to the L1 input of [Gradient Control]. For the t input plug the data from the Column F panel.
- STEP 03: Create Line Thickness
Plug the Data from the Column E panel to [Multiplication] and use a [Slider] (with R number 0<x<1) for the other input.
- STEP 04: Use Custom Preview
Use the [Custom Preview Line Weights] component. Plug to the G input the G output of [Move]. For the S input plug the [Gradient Control]. For the T input plug the [Multiplication].
- STEP 05: Bake with custom attributes
Use [Create Attributes] to customize the object to bake. Plug to the col input the [Gradient Control]. Plug to the PW input the [Multiplication].
Use [Bake Geometry] to bake. Plug the Geometry, the output of [Create Attributes] and a [Boolean Toggle]. To Bake, double click on the toggle.
RHINO
Visualize line weights and Export for post-processing
- STEP 01: Visualize Line weights in Rhino.
When baking from grasshopper, visualizing lineweights is not possible at first. To fix this: type in the Command Bar, PrintDisplay. This command will give options, set them in the following way.
- State > ON
- Color > DISPLAY
- Thickness > 10 (This defines a screen resolution to multiply object’s Print Width)
- STEP 02: Prepare to export
Through the viewports find the best view of the object. Once this is set type in the Command Bar > Named Views. Then Save the View and name it.
- STEP 03: Export
Select the objects you want to export, the click File > Export Selected. A window will pop out, give a Name and save as an “Adobe Illustrator (*.ai)”. Select the right Export option and click OK.
POST-PROCESSING IN ADOBE ILLUSTRATOR
Change the stroke scale of the z lines without changing their locations. Learn how to apply effects on them
- STEP 01: Scale Line Stroke
For a better workflow, make sure that the Z-lines are located in their own layer and name it “Z-lines”. Select the lines, then Object > Transform > Transform Each In the following window, UNCHECK: Transform Object and CHECK: Scale Strokes and Effects
Have the Preview on, for better visualization.
![]()
- STEP 02: Blur Effects and Blending Modes
Select the Z-lines, Copy them (Ctrl + C) and Paste them in Place (Shift + Ctrl + V) or Edit > Paste in Place.
The newly copied lines will be selected, in the Layers panel create a New Layer “ Z-lines 02” and drag the lines here. This second layer will be used as base layer for the following effects.
– With Gaussian Blur: Select lines in layer “Z-lines”, then Effect, Blur, Gaussian Blur. In the window have the preview on, and select the right ratio. With the selected lines go to the Transparency panel, select Blender mode: Screen and Opacity: 50%.
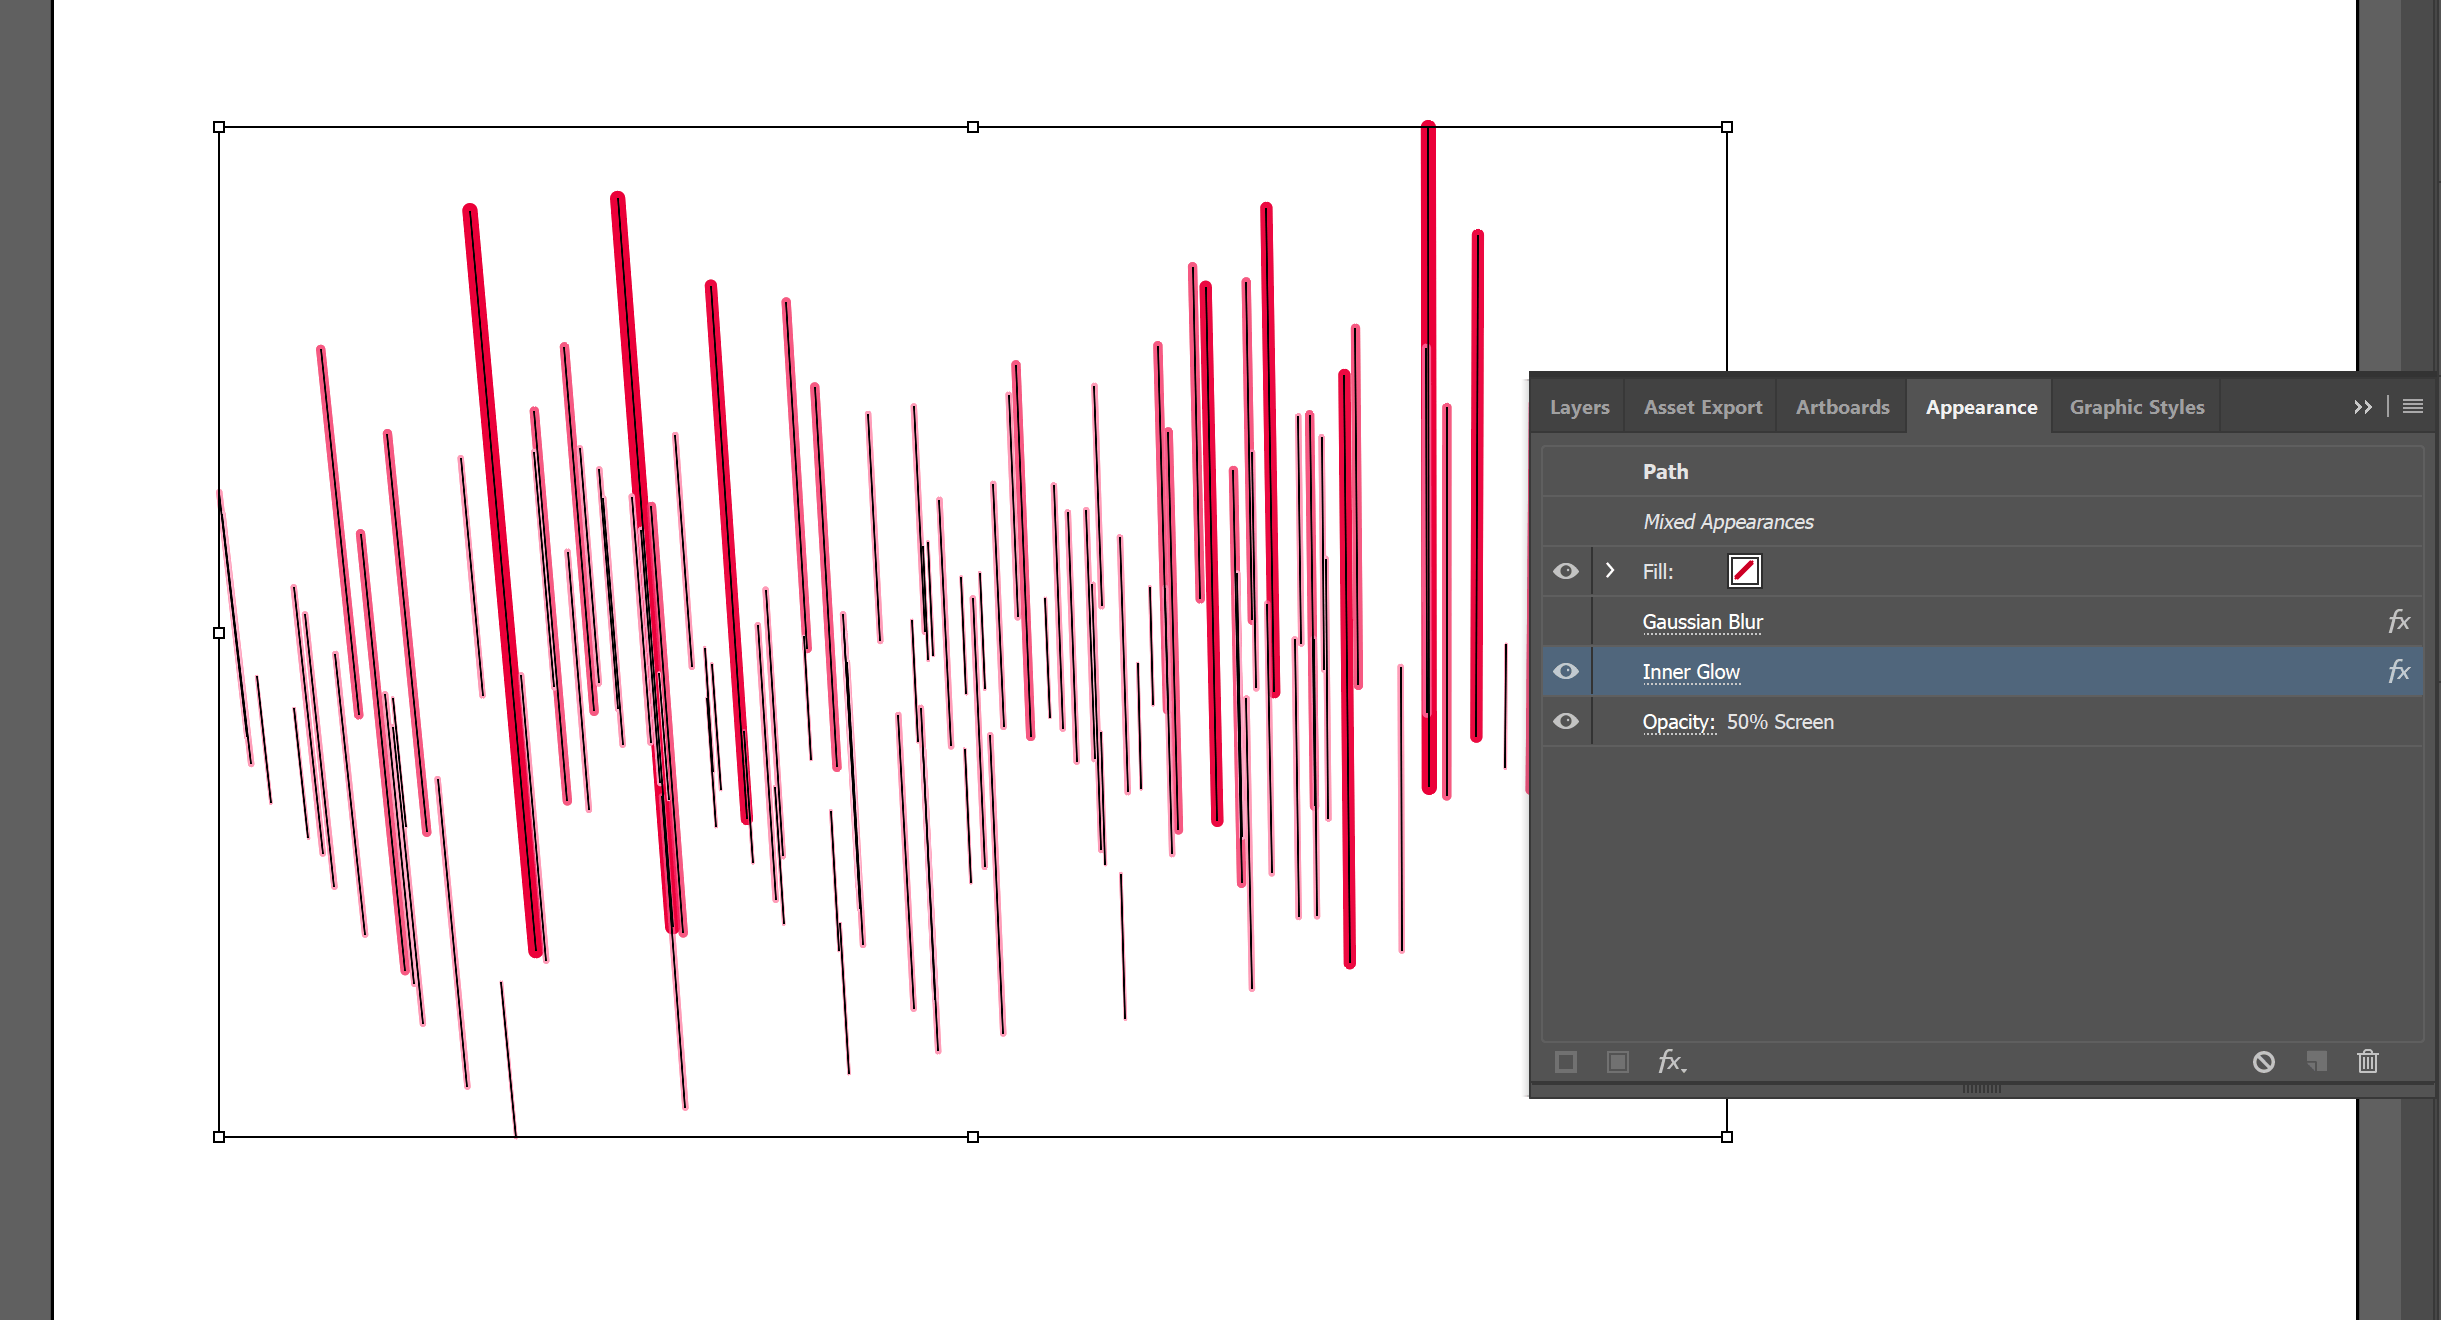
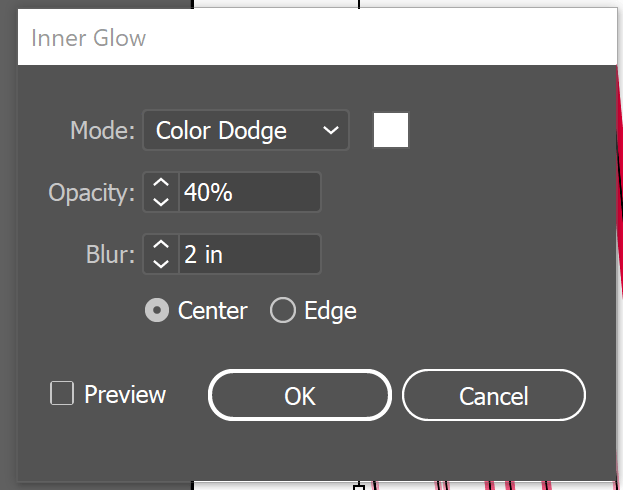
– With Inner Glow: Select lines in layer “Z-lines”, then Effect, Stylize, Inner Glow. In the window have the preview on, and select the right settings. With the selected lines go to the Transparency panel, select Blender mode: Screen and Opacity: 50%.
If outcome is not the wanted one, it is possible to edit the effects or delete them. In order to do this select lines, go to the Layer Panel, and click on the Appearance tab. Here choose what effect you want on or off. To edit the effect double click on it.