
Assignment #3
Great meeting with Phil Farrington. Material is on the table. Please do not remove it from there but do look at it. I have requested digital files.
//
Please re-read the reading from last week focusing on pertinent parts to your urban design qualities of interest- especially the Journal of Urbanism article A human-scaled GIS measuring and visualizing social interaction in Barcelona’s Superilles,
Please also read the following as it explains the method from urban analysis to urban design to urban architecture: “Parametric Methods and Place’, Journal of Urban Design, by Philip Speranza
//
Please do the GH Elk v2.0 tutorial if you did not make it to the workshop. THIS IS ESSENTIAL so we can go on using the GIS VIZ TOOL this week.
In the workshop we started to use the GIS VIZ TOOL and you could peak at that if you like on the Google Drive location: 02.2_GIS VIZ TOOL/2018
//
1. TITLE
- Title: two words
- Authors
- Icon/Image of Feeling / Challenge
2. INTRODUCTION / PURPOSE: IDENTIFY PROBLEMS AND CHALLENGES TO URBAN HEALTH IN BARCELONA
- Title: Two-word title
- Purpose Sentences as typed paragraph: What is the problem/challenge of urban health in Springfield (prior in Barcelona), how is it applied to Superillas and social interaction? Who is affected (be as specific as possible); Why is it important, including social value? (highlight key words) Consider social issues and ecological issues (air, water, light, heat, animals and green light). (BCNecologia_Presentacio Superilles)
- Use the Social Interaction figure to choose two to three areas. List qualities and indicate with a symbol if it is a fixed urban quality or an urban phenomena.
- Small thumbnail pictures and/or narrow texture of swatch of qualitative image/material perhaps hinting at final output. Graphic hints: set the tone for the unit and highlight color here.


3. BACKGROUND: Context
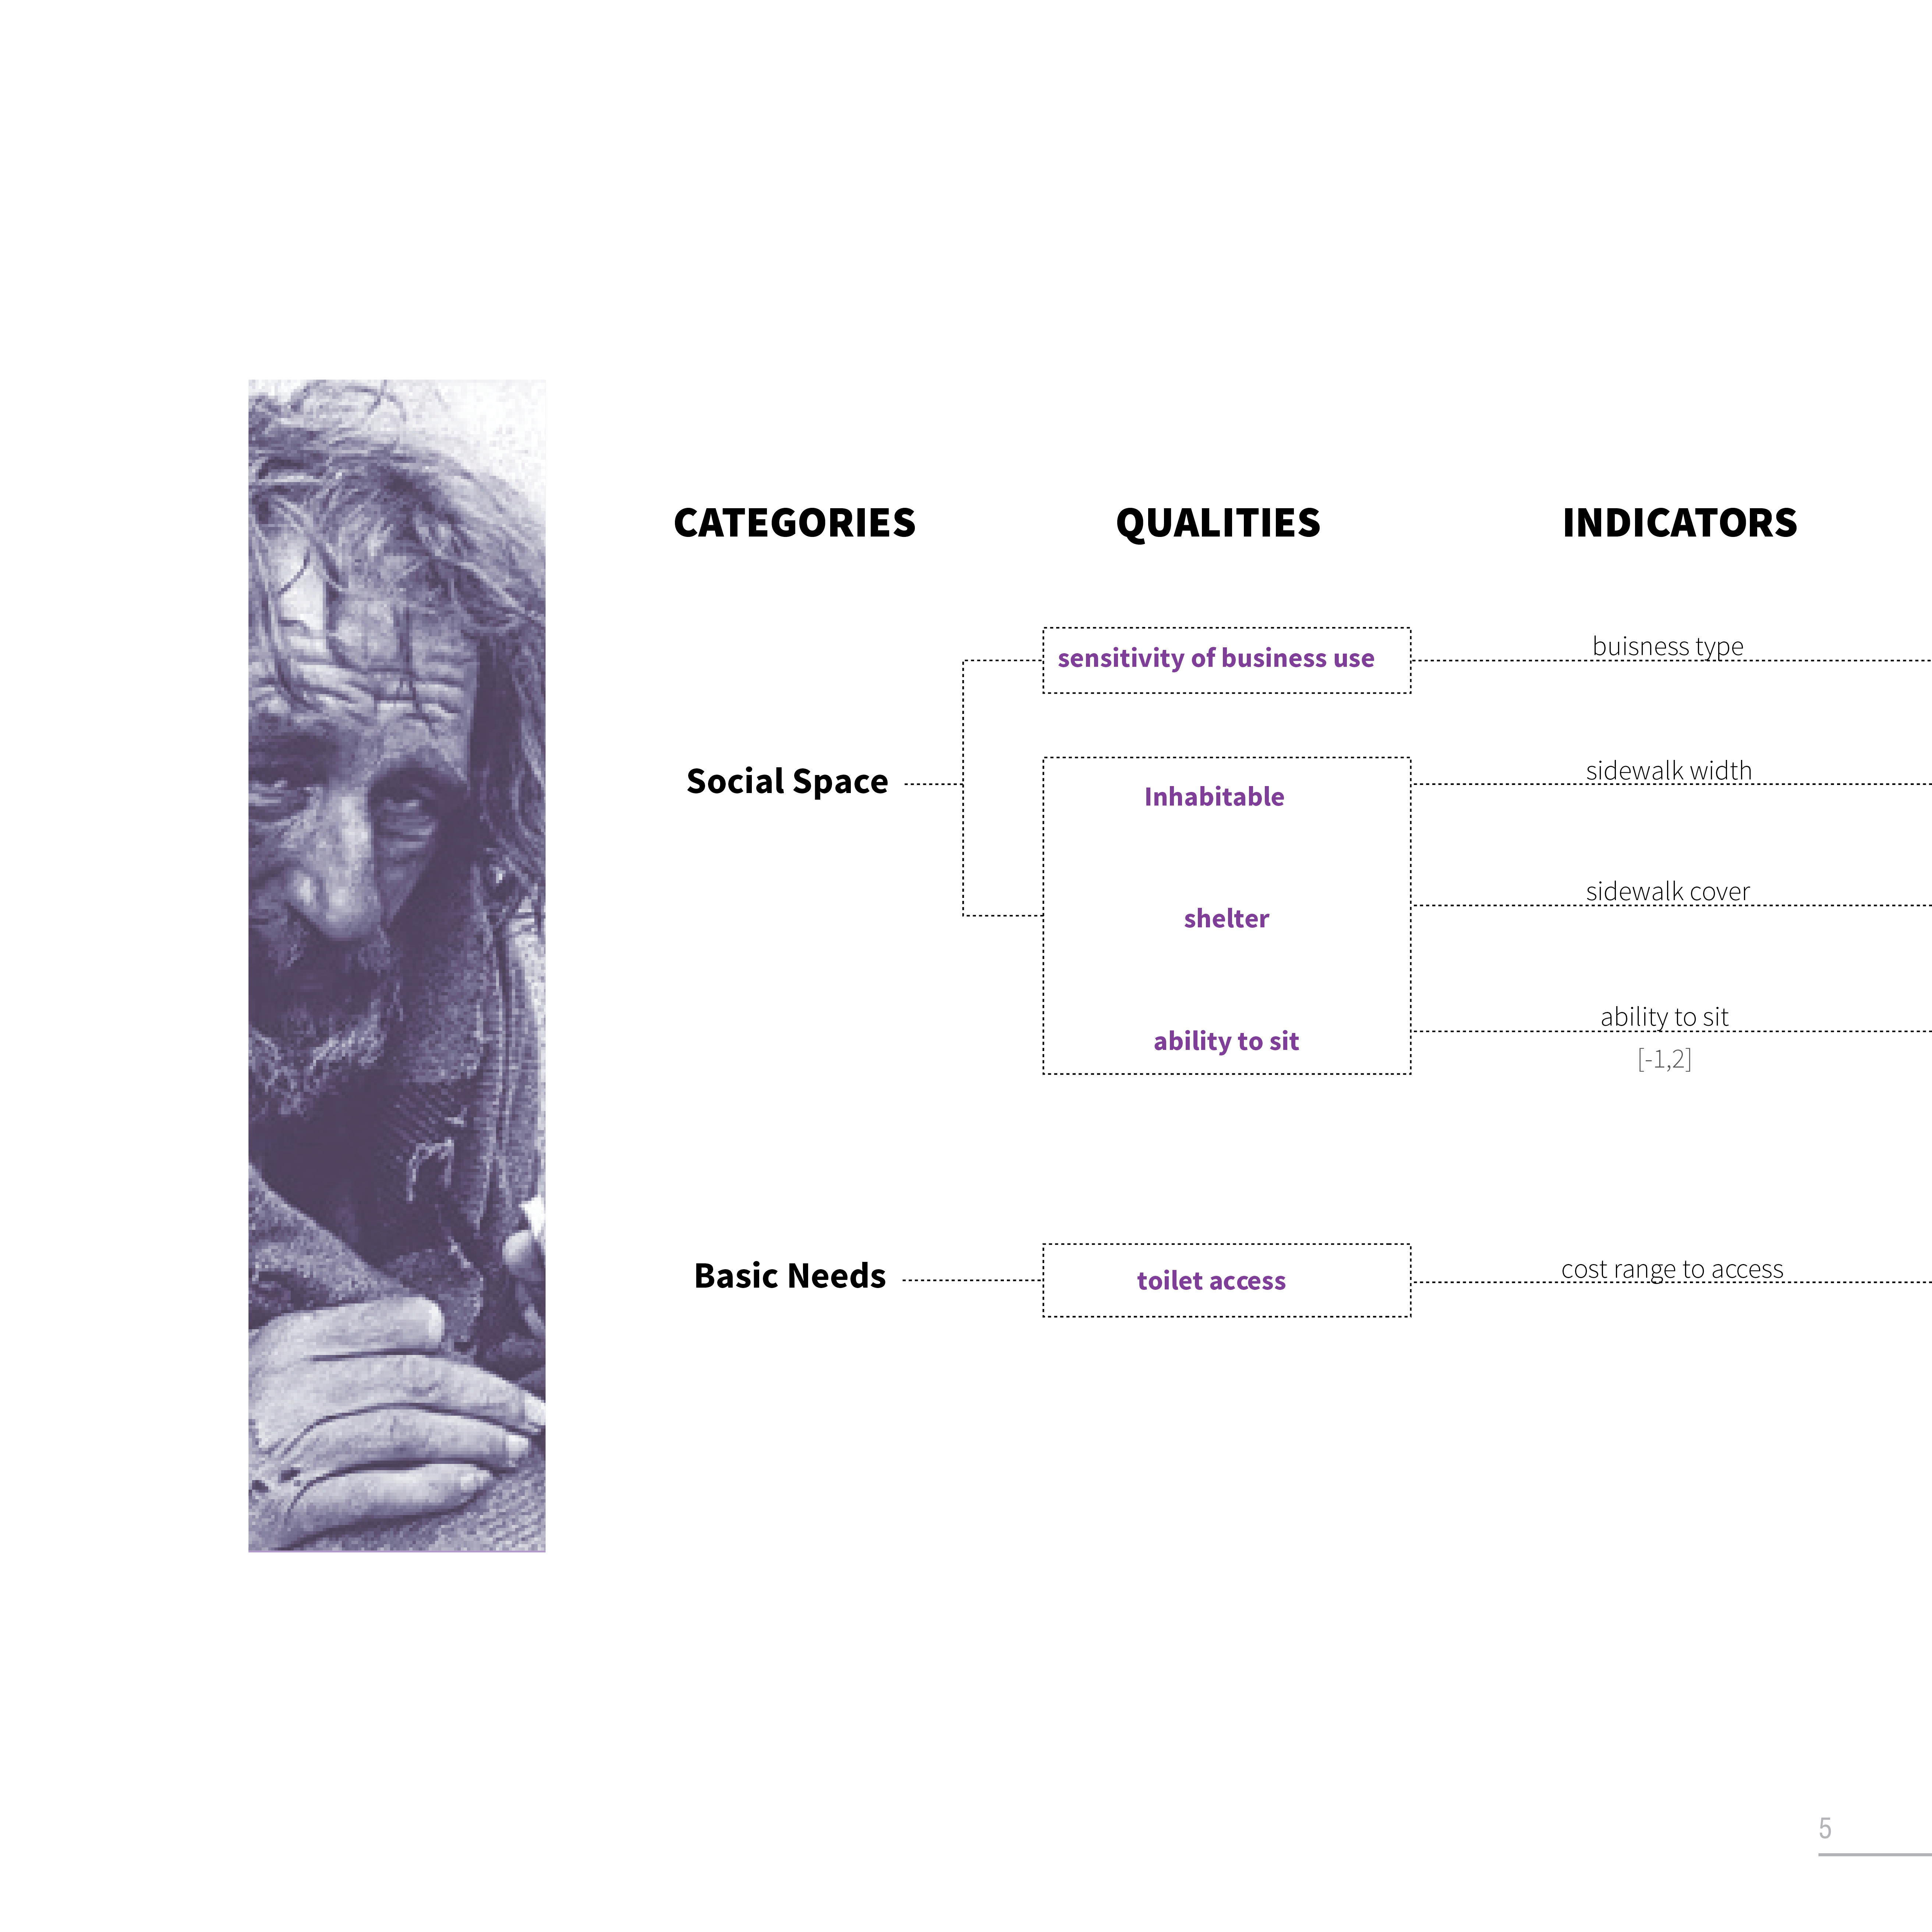
- Outline: Diagram and or Google Sheet of Purpose / Categories / Qualities / Indicators (history) / On-site or Off-Site / Fixed or Phenomena
- Literature Review: (3) quotations of theory / reading (Password: Barcelona). **Address ideas from the reading that include: downtown urbanism; Latour’s idea of attachment; Morales’s ideas on how the Eixample Plan Cerda works; Corner’s idea of adaptability with specificity; Jacob’s idea of unpredictability; Schartz’s idea of scenarios; Guallart’s idea of self-sufficiency (post); Jan Gehl’s ideas of walkability (post); or other ideas from the readings.
- Research Superilles and current Springfield (prior in Barcelona) health and livability problems/challenges: 1- 3 recent articles as quotations or informational statistics (Register Guard, Oregonian, City of Springfield website) (prior in El Periodico, El Pais, other) (FYI, City of Barcelona is Ajuntament de Barcelona; Catalan Government is Generalitat).
- Comparative Statistics: Infographics to set a quantitative baseline big picture to small picture indicators to follow. Research climate information by month or season such as precipitation, temperature highs and lows, relative humidity, wind direction and speed, animal migration. Research effects of human behavior such as sources of sound pollution (discos, tourists, terraces, schools), air pollution (terraces, construction, restaurant hours), light pollution (cars, commerces).
4. BACKGROUND: Quantitative and Qualitative Baseline (statistics and info-graphics)
-
- Qualitative media: picture (zoomed in) of your urban design characteristics (criteria)
- Abstract scientific data: measurement of basic relationships, statistics related to measure quality (ex. 6:1 water to urban farming recommendation). Abstract and Baseline models. Ex. Cost of water Barcelona / Granada. Ex. Overnight temperature difference, humidity, income per capita, etc.
- Policy Context: Springfield, Oregon, USA. (prior in Catalan/Barcelona/ 22@ 10/10/10, BCNecologia_Presentacio Superilles, Patrimonio (Generalitat/Ajuntament) vs comparative city such as Portland, Madrid, EU. Can you find relevant law or ordinances in Barcelona, Catalunya, Spain or the EU
- Ecology: Bar charts and graphs may also be helpful, especially for quantitative contextualization.
- Sensors (on-site): What sensors might be helpful? +Find online an example with script and prototype diagram.
- Real-time Data (off-site): What databases exist?
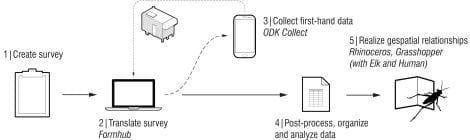
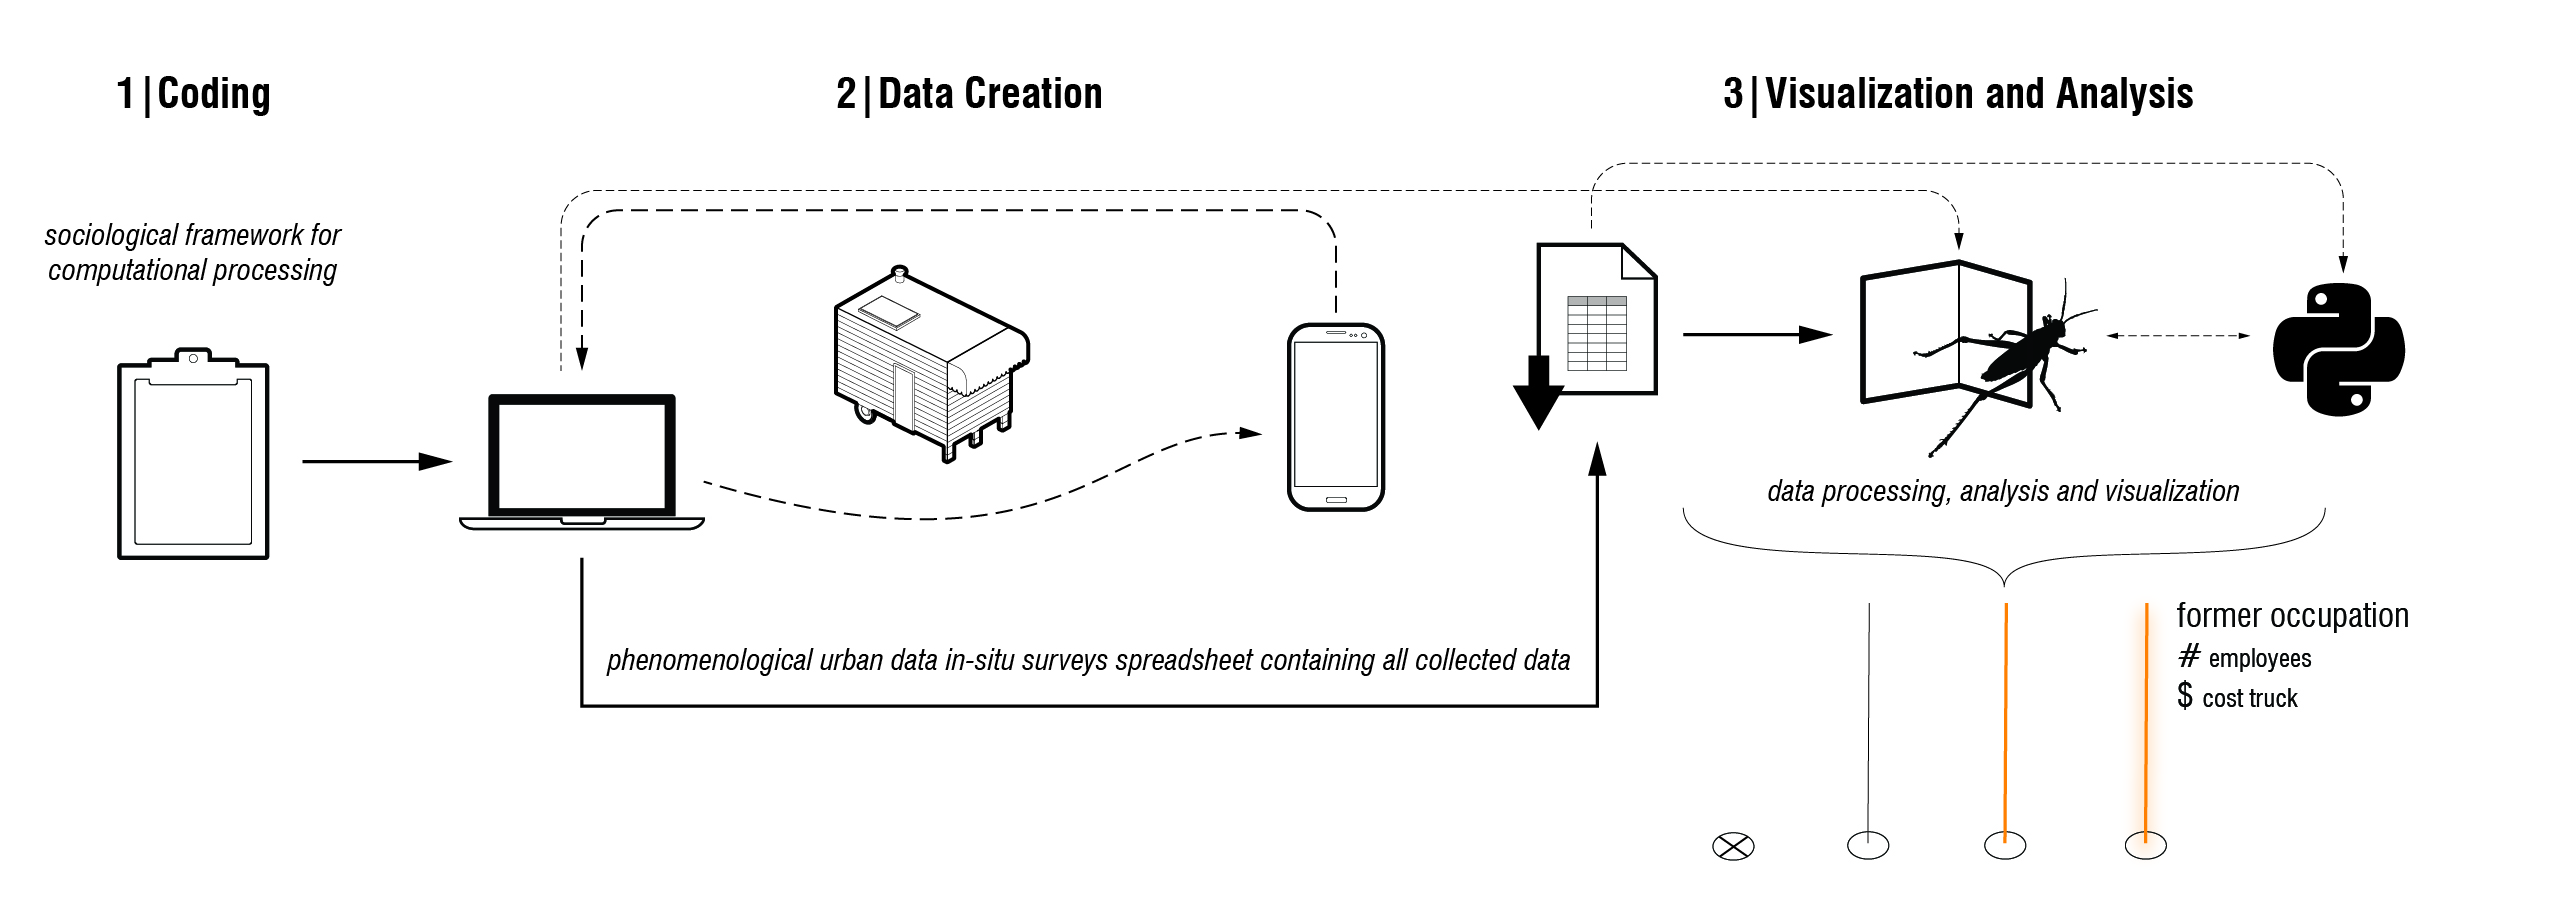 Figure above, Stephen Maher’s Diagram for Elephant tool and Food Cart / Food Truck Study Portland and New York.Data dimension: accessing urbandata and making it accessible,
5. METHOD
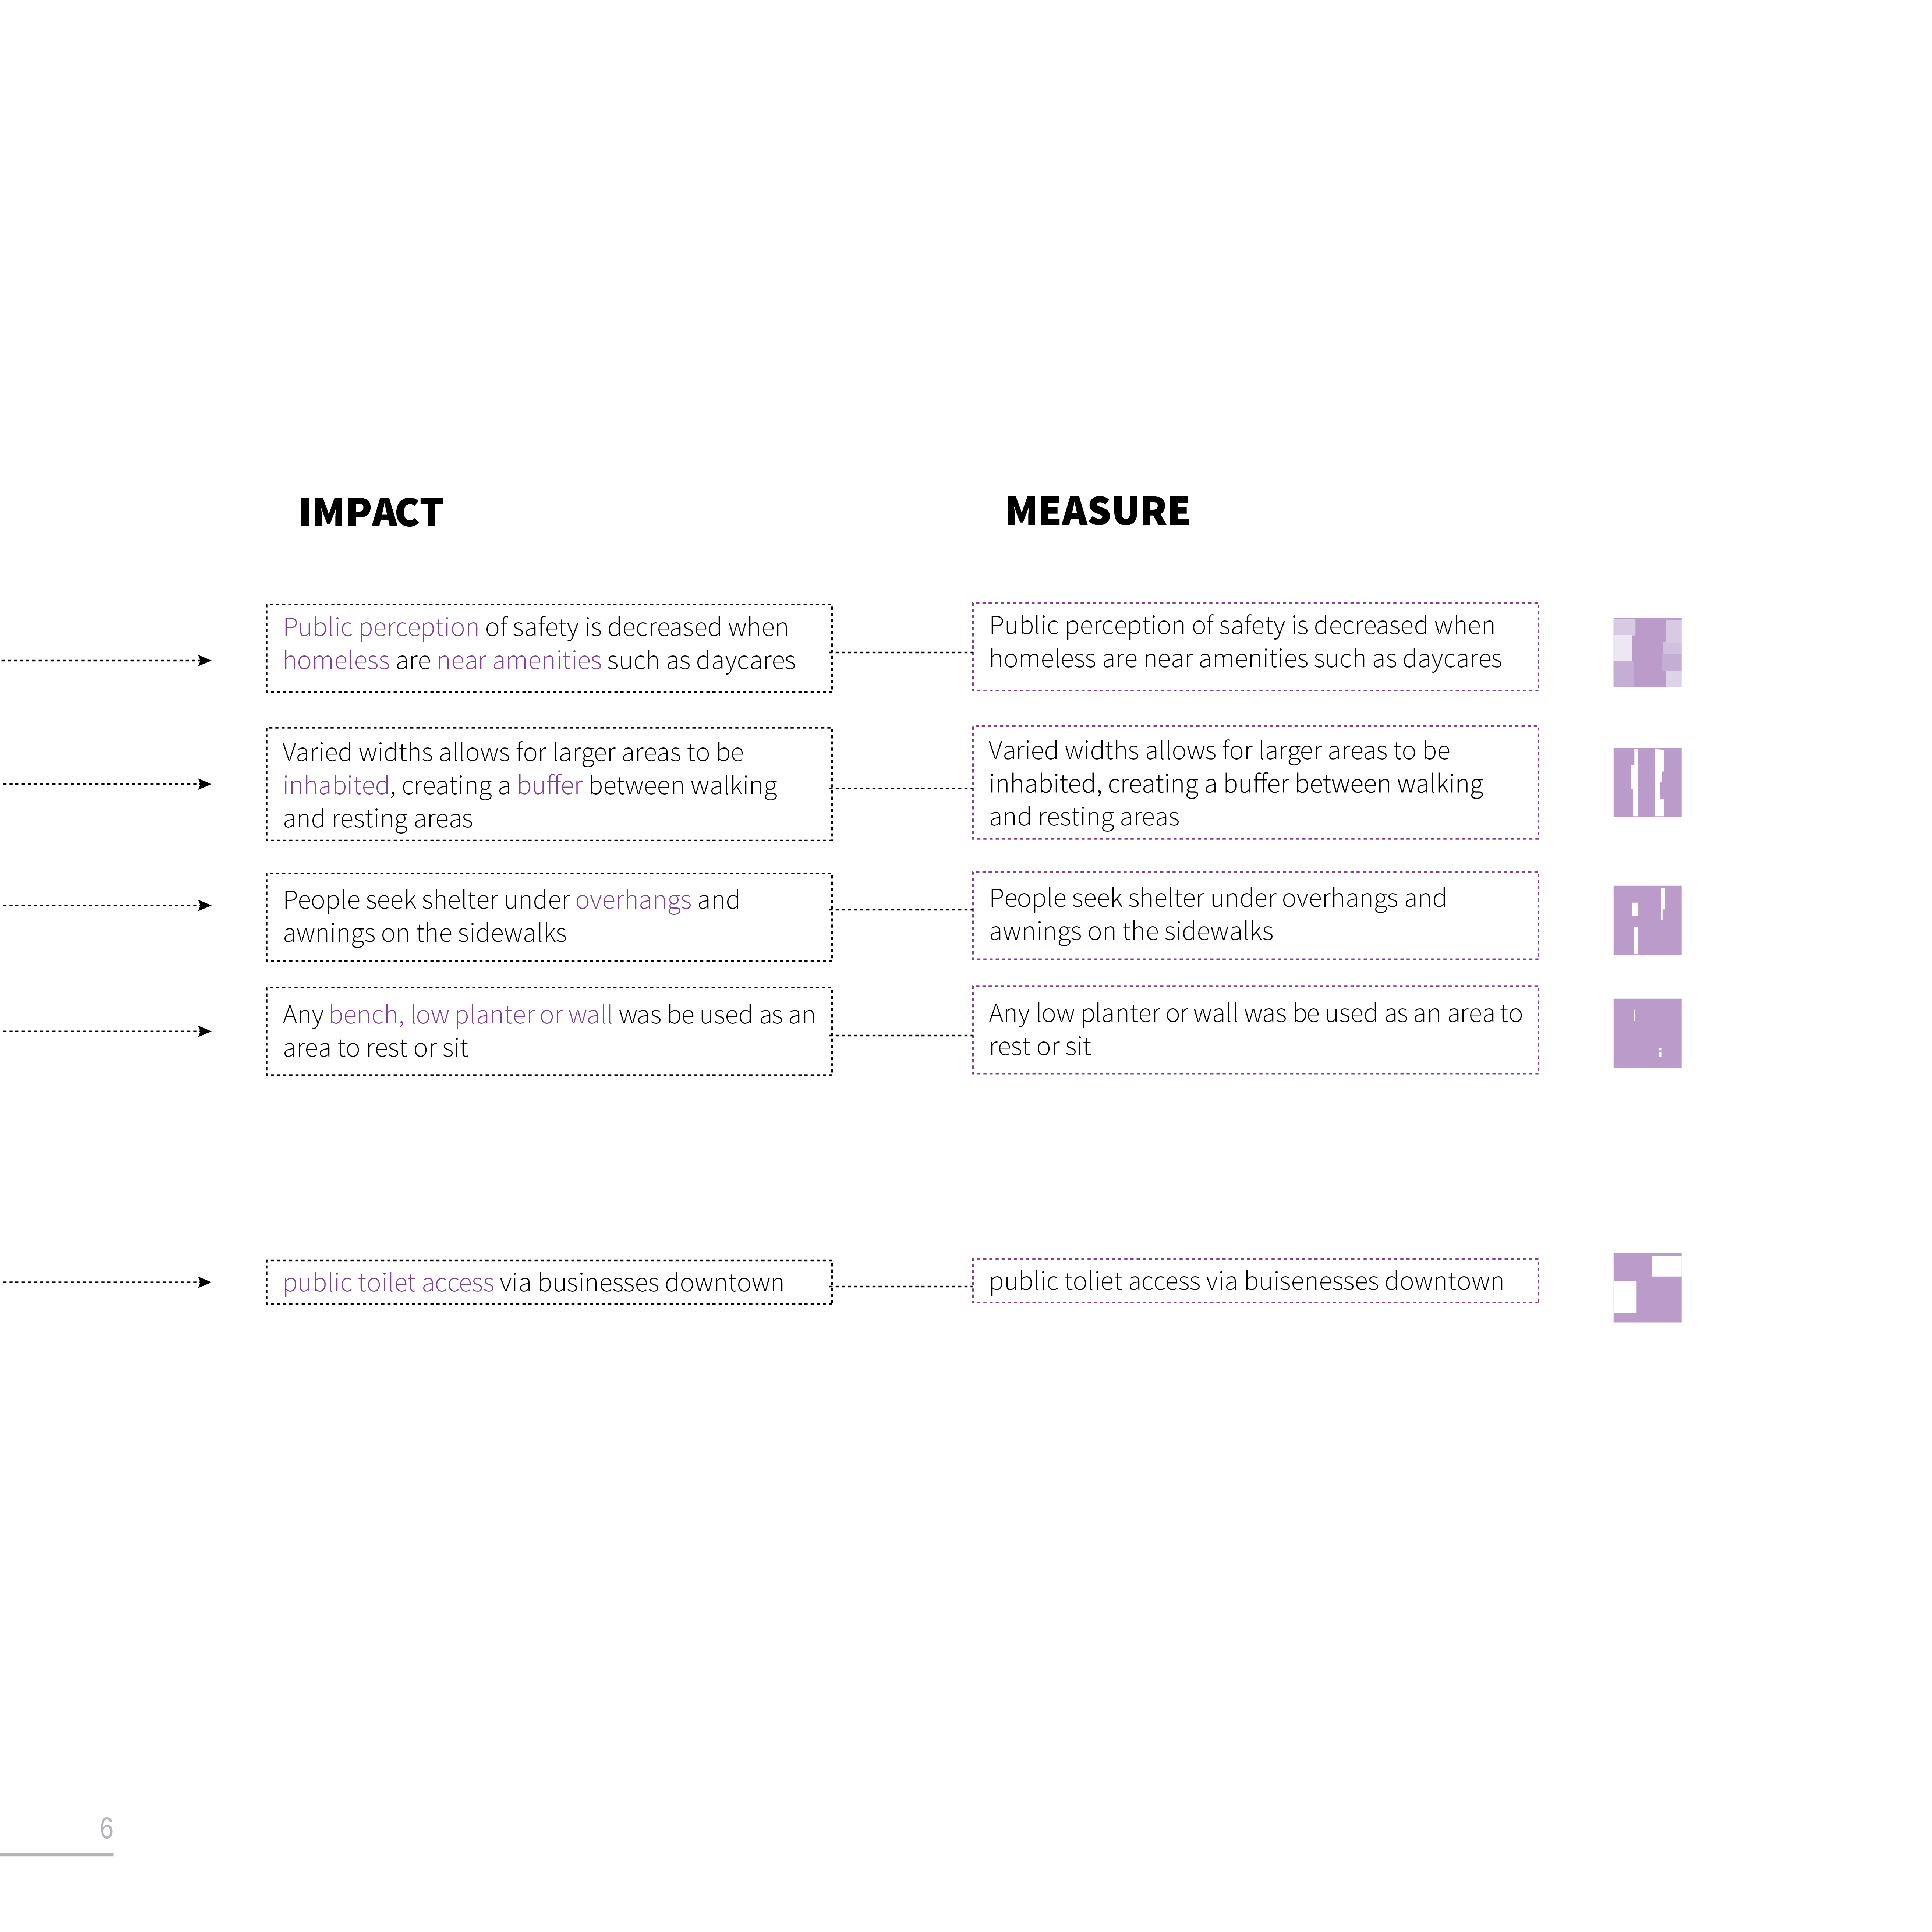
- Workflow Diagram : Categories, Qualities (history), Indicators, +Data Dictionary Descriptions, +Numerical Coding, Impact, Measurement, Thumbnail Diagram and or Icon.
.