Call it “Mission Improbable.”
Assign teams of journalists, digital developers, designers, civic leaders and students – most never having worked together — to produce data-driven tools and stories tackling some of the toughest issues facing Portland and Oregon. And get it done in 72 hours.
After three days and a few missteps, mission (pretty much) accomplished.
The University of Oregon School of Journalism and Communication’s Agora Journalism Center event in Portland, March 26 to 28, was billed as a “Storytelling with Data Build-a-thon.” Five civic topics were addressed: housing, education, earthquake preparedness, campaign finance and economic innovation.
“I’ve been to a number of hackathons in the past,” said digital developer Nik Wise. “This one was different because it was a hackathon on things that really matter.”
Moreover, the emphasis was on “deliverables” rather than conceptual pitches and mock Internet pages that often constitute the end result of hackathons.
“I was not sure that we would be able to do it,” said Catherine Nikolovski of Hack Oregon, a community non-profit that partnered with the Agora Journalism Center to conduct the three-day collaboration.
By the 6 p.m. Saturday deadline, the deliverables were in place:
- A 16-page “Story of the Story” booklet artfully laying out the build-a-thon’s challenges and accomplishments.
The intent of the collaborative effort was to show “how we can engage with the technical and creative people around Portland and the media markets so we take advantage of each expertise,” said Andrew DeVigal, SOJC Chair in Journalism Innovation and Civic Engagement. Media partners included Oregon Public Broadcasting, the Oregonian, Portland Business Journal and Willamette Week.
The process began in December, when a brainstorming session identified the civic issues that the build-a-thon hoped to address. In the interim, each team assembled data for the build-a-thon.
Making the data meaningful proved to be the hard part.
DAY ONE
At 8 a.m., the build-a-thon is underway. Only one unexcused absence out of 55 pre-registered participants, despite the sun basking Portland with the best weather of the calendar year.
They came equipped with files and files of digital information – megabytes of data, so much so it is hard to find the storyline.
Each team wrestles with a “chicken or egg” quandary – what drives the project, the data or the story? Again and again, they return to two key questions: What do we want to find out? What’s doable in 72 hours? The answers were not readily apparent.
“We’ve gone completely down the data rabbit hole,” mused John Strieder, a University of Oregon multimedia journalism student working on the earthquake preparedness project.
The campaign finances team at first focuses on a prolific campaign operative. No story found. Then the group probes suspected illegal comingling of political funds. An unproven case for another day.
“So we started off with a total fail,” said team facilitator Marcus Estes. “This is part of the method. Failed experiments are not harmful. They’re helpful.”
And then, one way or another, the teams pivot, finding a new source of data or a new way of looking at the data in hand. Workable story visions come into focus.
DAY TWO
Seven bearded men huddle silently around a conference table, each peering intently into his laptop computer. On the wall hang pages of scribbled notes. The team wants to create an interactive tool simultaneously accessing a half-dozen datasets on seismic conditions.
“Our problem was not having not enough data but too much,” said Tony Schick, a reporter with Oregon Public Broadcasting.
The group hones in on information that would deliver personalized information telling what will happen to your home or community when the Big One shakes Oregon. To get beyond “doom and gloom,” the team adds a dataset providing individualized information on how to best prepare for a devastating seismic event.
For the education group, the challenge was merging incompatible data — thousands and thousands of data points with inconsistent headings. Coders hurriedly prepare scripts to standardize the information over 10 years of data collection.
Even more daunting for the education group is finding a way to account for socioeconomic conditions when assessing school performance. A data “goldmine” is uncovered: a compilation of subsidized lunch statistics – a proxy for measuring students in poverty.
DAY THREE
The focus shifts from data collection to data presentation.
The campaign finance group builds a map tracing the flow of money between Political Action Committees. The result is a dazzling visualization that resembles a galactic explosion – but what does it mean? How about animation to show the money flow over time? Can it be accomplished in the day’s remaining hours? Back to coding.
An invitation is sent out via social media inviting the public to view the build-a-thon’s results. Fifteen minutes before the presentations begin, team members still hover over laptop computers making final revisions.
6 P.M.

To a standing-room-only meeting hall, the projects are unveiled:
Housing: A web application that identifies 19,000 vacant properties in Portland and enables users to vote in real time on how best to transform that abandoned lot down the street.
Education: Drawing from 10 years of disparate data, an interactive tool that enables you to gauge individual school performance.
Economic Innovation: A consolidated database tracking diverse factors that contribute to healthy economic growth.
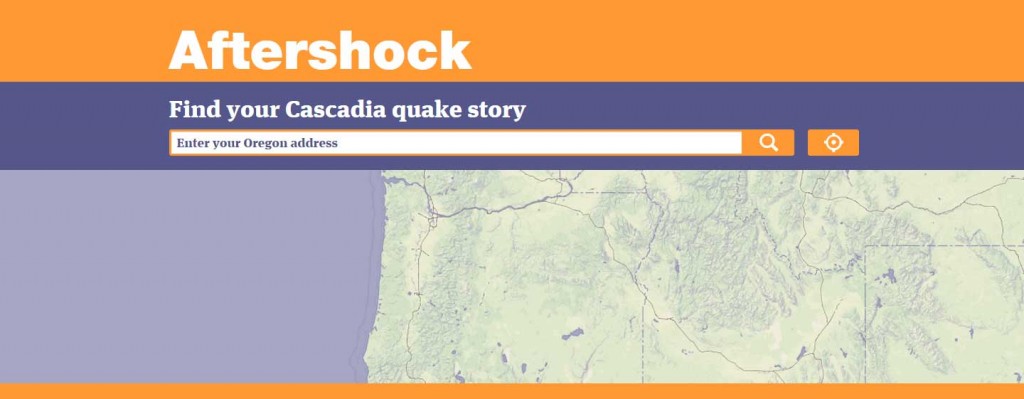
Earthquake Preparedness: A web application that produces a “personal story” on what will happen to your home and community when a major seismic event occurs.
Campaign Finance: A revealing look at the convoluted web of PAC backscratching: the money you donate may end up in another campaign’s coffers.
At the end of the day, 72-hours of collaboration was on display. Collaboration from developers to civic leaders to journalists to craft the story that directly affects the Portland and Oregon community.
“For me, this has been a learning opportunity, a chance to meet some great people and an opportunity to give back to the community,” Madhavi Bharadwaj, the facilitator for the economic innovation team, wrote in an email following the event. “The last 3 days prove that when civic minded professionals collaborate, the possibilities are endless.”
About the SOJC Agora Journalism Center: A gathering place for innovation in communication and civic engagement, the Agora Journalism Center explores new visions of democratic, interconnected journalism. The Agora Journalism Center is a part of the University of Oregon School of Journalism and Communication.
About Hack Oregon: A community non-profit organization, Hack Oregon builds civic data projects designed to promote engagement, awareness and quality of life.
Scott Maier is an associate professor at the University of Oregon School of Journalism and Communication. Maier’s career as a newspaper and wire-service reporter included covering city hall, the state legislature, Latin America, and a variety of other news beats. He was founder of CAR Northwest, an industry-academic partnership providing training in computer-assisted reporting to newsrooms and journalism classrooms.
Link to article: http://www.pbs.org/mediashift/2015/05/turning-data-into-civic-tools-journalists-coders-students-collaborate-in-portland/
 About the Author: Geoff Ostrove was instrumental in helping to gather data for this project and connecting the team to subject area experts. Currently finishing his PhD in Media Studies, Geoff received his MCRP from PPPM in 2013 and is working with the Oregon Infrastructure Finance Authority’s Seismic Rehabilitation Grant Program as the Oregon Sea Grant’s Natural Resources Policy Fellow. For more information about what Geoff is up to these days, check out his blog at http://blogs.oregonstate.edu/seagrantscholars/author/sea_ost/.

