These days I spend a lot of time on “hands-on development of faculty research projects,” in the words of my job description, or what I would call coaching. I’m working with three Mellon Faculty Fellows (whom you can read about here) on research projects that will result in digital exhibitions. In each case, the Faculty Fellow is trying something new: a new exhibition platform, a new way of doing their research, or a new way of communicating with their audiences (both students and the public). Luckily, digital exhibitions are something that our colleagues in Digital Scholarship Services deal with all the time. The fine folks in the Digital Scholarship Center (especially Kate Thornhill—hi, Kate!) are teaching me how digital exhibitions get made, and then I coach the Faculty Fellows on translating their ideas into websites.
This coaching takes place in meetings with the Faculty Fellows (and sometimes also their collaborators) where I help them map their ideas onto the available technology. I teach my Faculty Fellows how WordPress and Omeka S work, help them organize their content, and ask them a lot of questions about how they want their exhibitions to look and feel for users.
Right now I’m spending time every week with one Faculty Fellow, Professor David Frank from the Clark Honors College, to help him divide a book-length research project into a manageable number of webpage-sized chunks for his digital exhibition. Here are the steps I took:
First, we had several discussions about what he wanted to communicate in his digital exhibition. We looked at examples of similar exhibitions and discussed the types of interactions he wanted his users to have. We sketched user personas and reviewed the digital assets (videos, texts, images, archival documents, etc.) that he wanted to include in his exhibition.
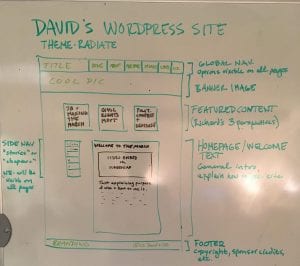
I reviewed all of this information with the Digital Scholarship Services staff. They identified a platform (WordPress) and some additional software that would fit David’s needs and sent me back to him with a list of things they needed from him, like a sitemap, some direction on look and feel, and a complete list of all the digital assets he wants to include.
The digital asset list for this exhibition was in danger of expanding endlessly. That’s what happens when you’ve got a great research project and are passionate about your subject! To move the project forward (and help keep the asset list focused on the essentials), I went back to David and asked him to think of his digital exhibition like a book. What is the overarching argument or narrative thrust of the book? What are the book’s chapters? What pieces of evidence or primary materials will appear in each chapter? I then showed him some examples of sitemaps and asked him to translate his book idea into a list of webpages arranged hierarchically with “little” pages nested under “big” ones.

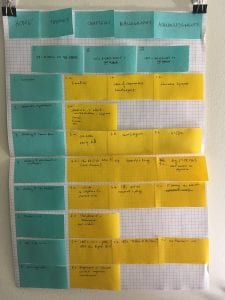
The sticky-note sitemap. Blue notes are “big” pages, yellow notes are “little” pages nested under the big ones.
Generating a detailed book outline turned out to be pretty easy, but translating that into a concise sitemap was a little more challenging. We sat down with his drafts and a stack of sticky notes, and I made one sticky note for each tab in the site’s navigation bar. One tab at a time, we looked at his ideas and broke them into webpage-sized chunks, then gave each chunk its own sticky note. An hour later, we had a concise, hierarchical sticky-note sitemap, and David had a much clearer understanding of what he would communicate on each page of his site.
I then made a spreadsheet to help him identify which digital assets were needed for each page of his site. For every page on the sitemap, the spreadsheet has rows representing relevant assets, with columns recording essential details like the assets’ filenames and copyright holders. By working with this spreadsheet, we are narrowing down our collection of digital assets to those that are most relevant and at the same time deciding where they go in the digital exhibition.
Our next step will be to hand off the list of digital assets to Julia Simic, Randy Sullivan, and Sarah Seymore for digitization and metadata processing. While they handle those important tasks, David Frank, my two Graduate Employees, and I will divide and conquer the original writing that needs to be done for the exhibition. To me this feels like a big step forward, both in terms of building the digital exhibition, and in terms of teaching a Faculty Fellow how to translate a multi-year research and publication project into a digital exhibition.

