Four separate maps showing different projections of the lower 48 United States, and how each projection distorts certain features
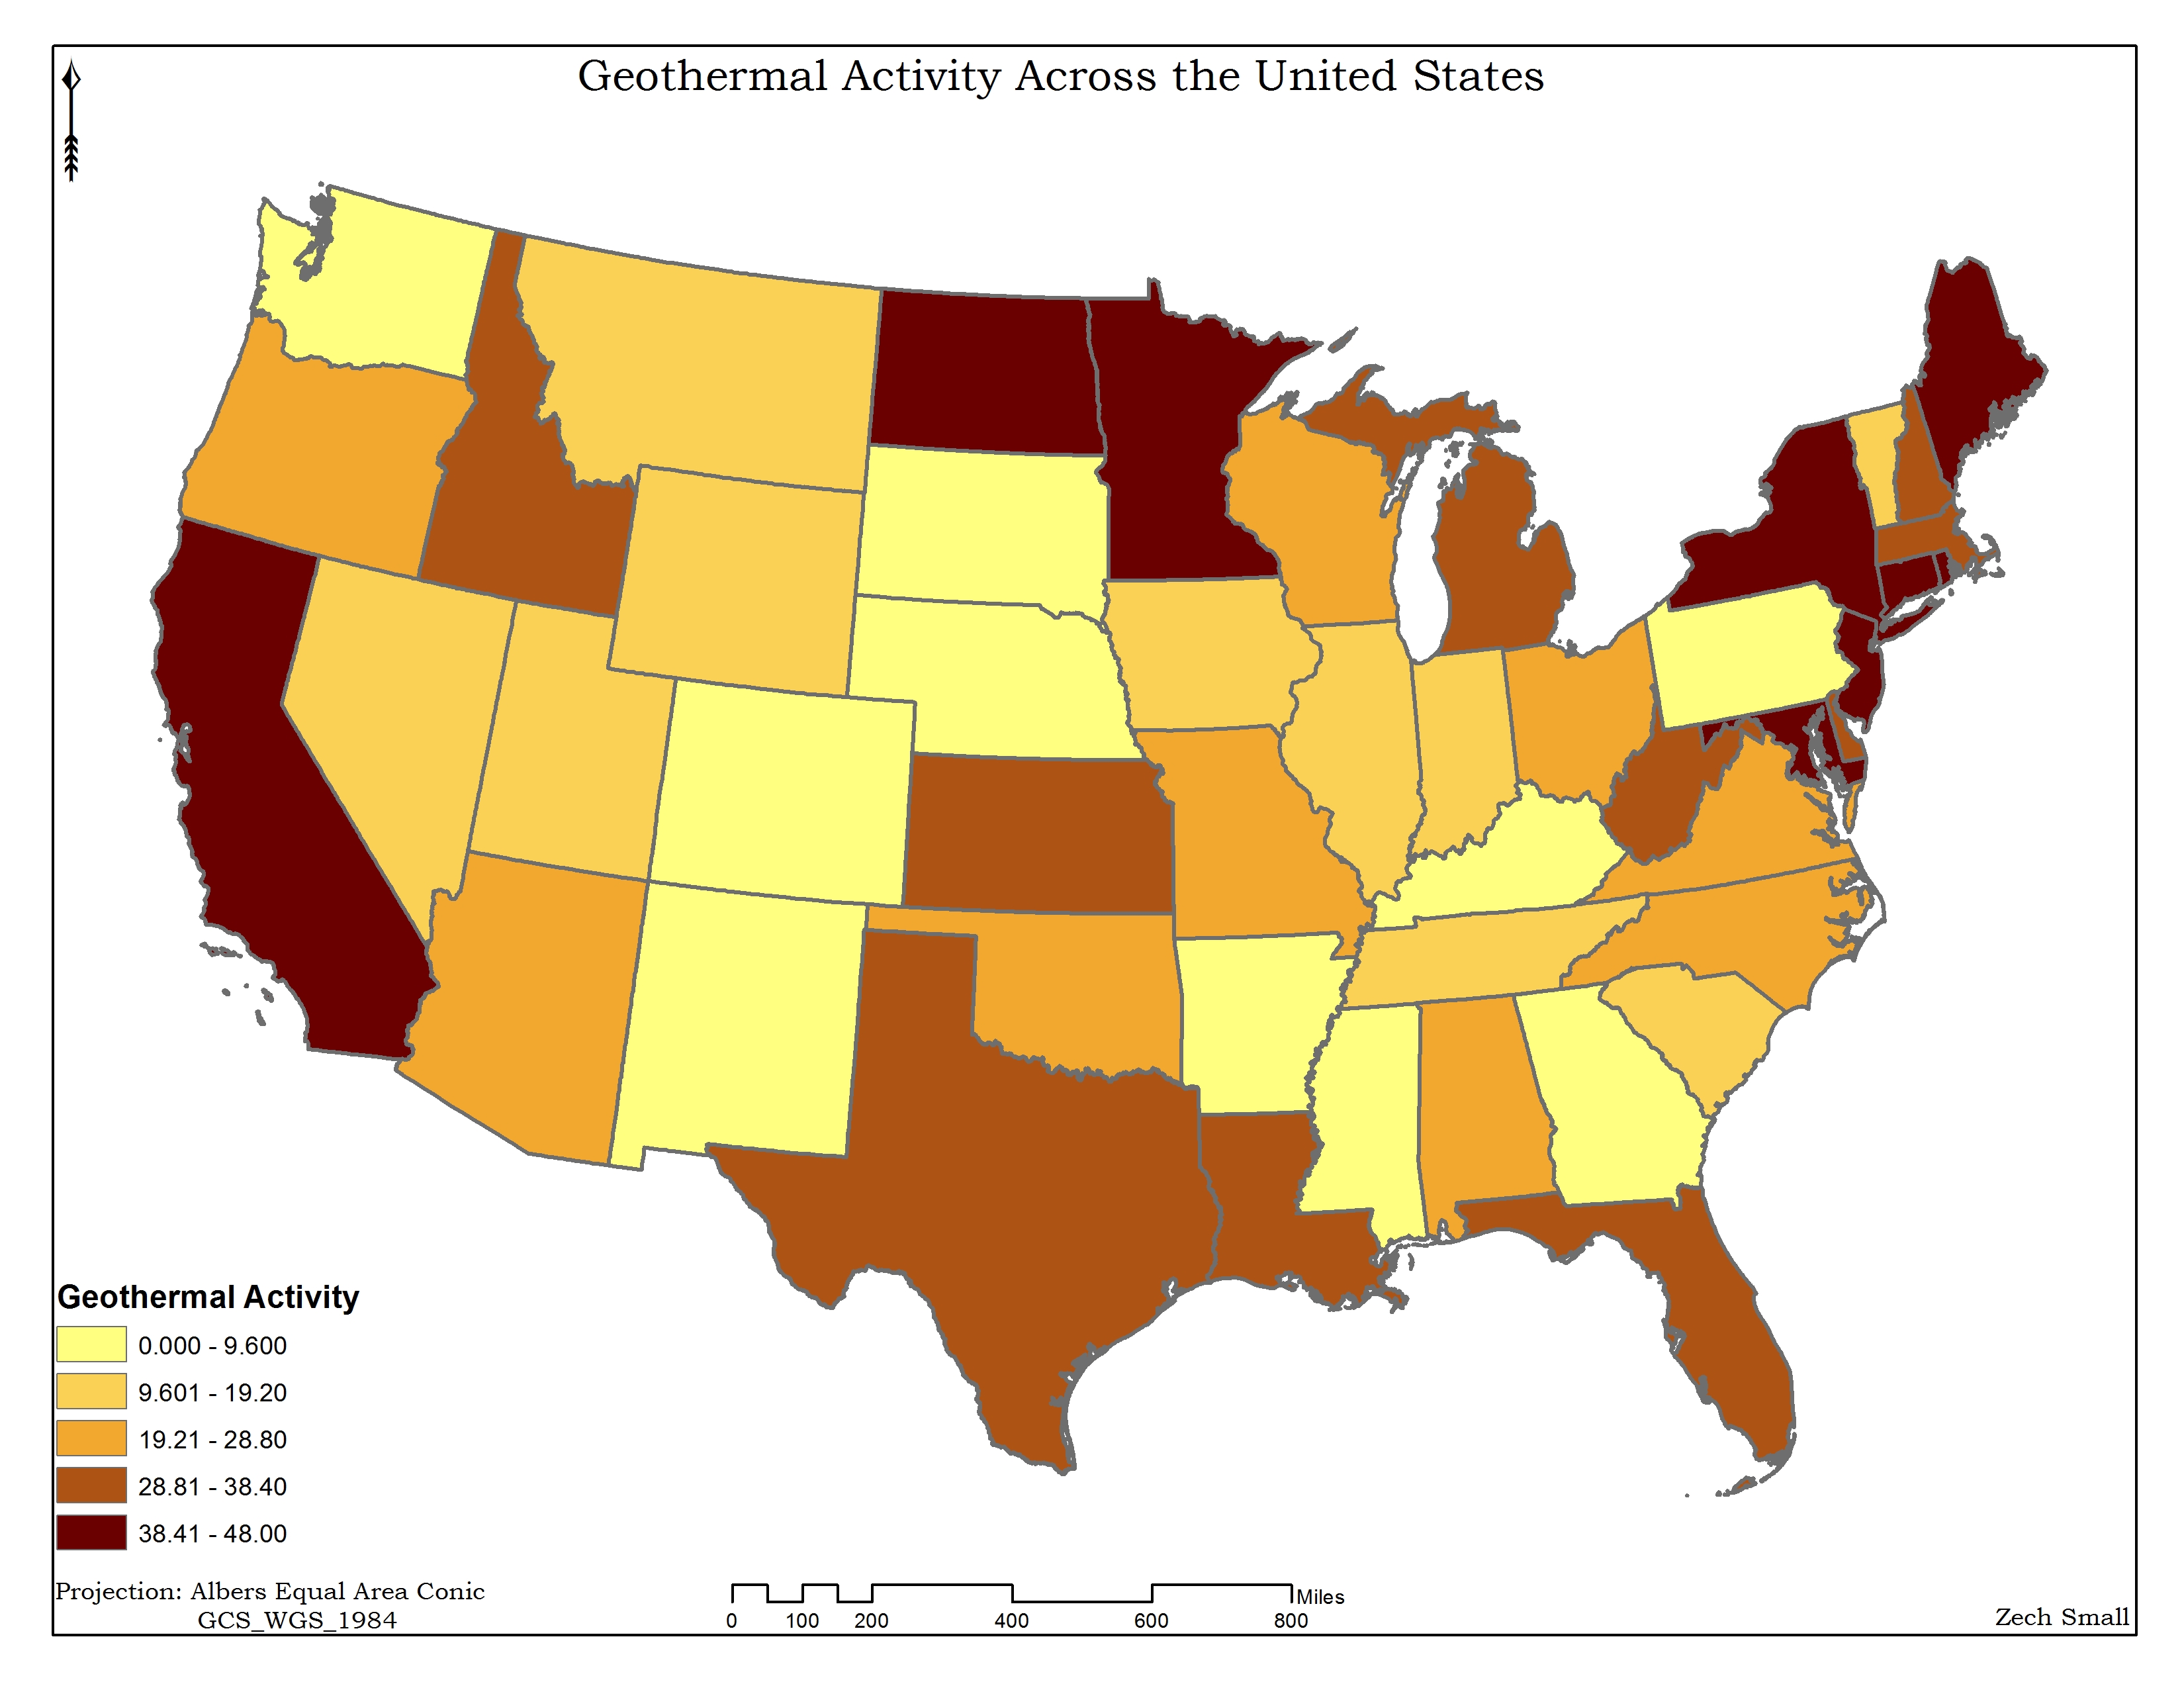
Albers Equal Area map showing geothermal activity across the United States using a geometrical interval classification, which is used for data that isn’t apportioned normally.
Albers Equal Area map showing geothermal activity across the United States using a Jenks classification, which is used to assign the best classification for the given values
Albers Equal Area map showing geothermal activity across the United States using a manual classification, which is good for manually assigning classes, but can cause data to be removed because it was not included.


