

06A Project 1 Midterm
Please post as [06A Project 1 Midterm] for Thursday, July 19, 2018. We will discuss and refine this week.
//
TEMPLATE: Please use InDesign files 16″ x 9″. We will post to a Google drive location.
- GH (GH, Rhino, CSV, OSM, etc);
- In-Design (In-Design File, PDF, Package);
- JPG (each page for Weblog and upload please) Please package HIGH resolution artwork 300dpi.
The below outline is just that. Ask me about variations. Think about how people will understand the work.
1. TITLE
- Title: two words
- Authors
- Icon/Image of Feeling / Challenge
2. INTRODUCTION / PURPOSE: IDENTIFY PROBLEMS AND CHALLENGES TO URBAN HEALTH IN BARCELONA
- Title: Two-word title
- Purpose Sentences as typed paragraph: What is the problem/challenge of urban health in Barcelona, how is it applied to Superillas and social interaction? Who is affected (be as specific as possible); Why is it important, including social value? (highlight key words) Consider social issues and ecological issues (air, water, light, heat, animals and green light). (BCNecologia_Presentacio Superilles)
- Use the Social Interaction figure to choose two to three areas. List qualities and indicate with a symbol if it is a fixed urban quality or an urban phenomena.
- Small thumbnail pictures and/or narrow texture of swatch of qualitative image/material perhaps hinting at final output. Graphic hints: set the tone for the unit and highlight color here.


3. BACKGROUND: Context
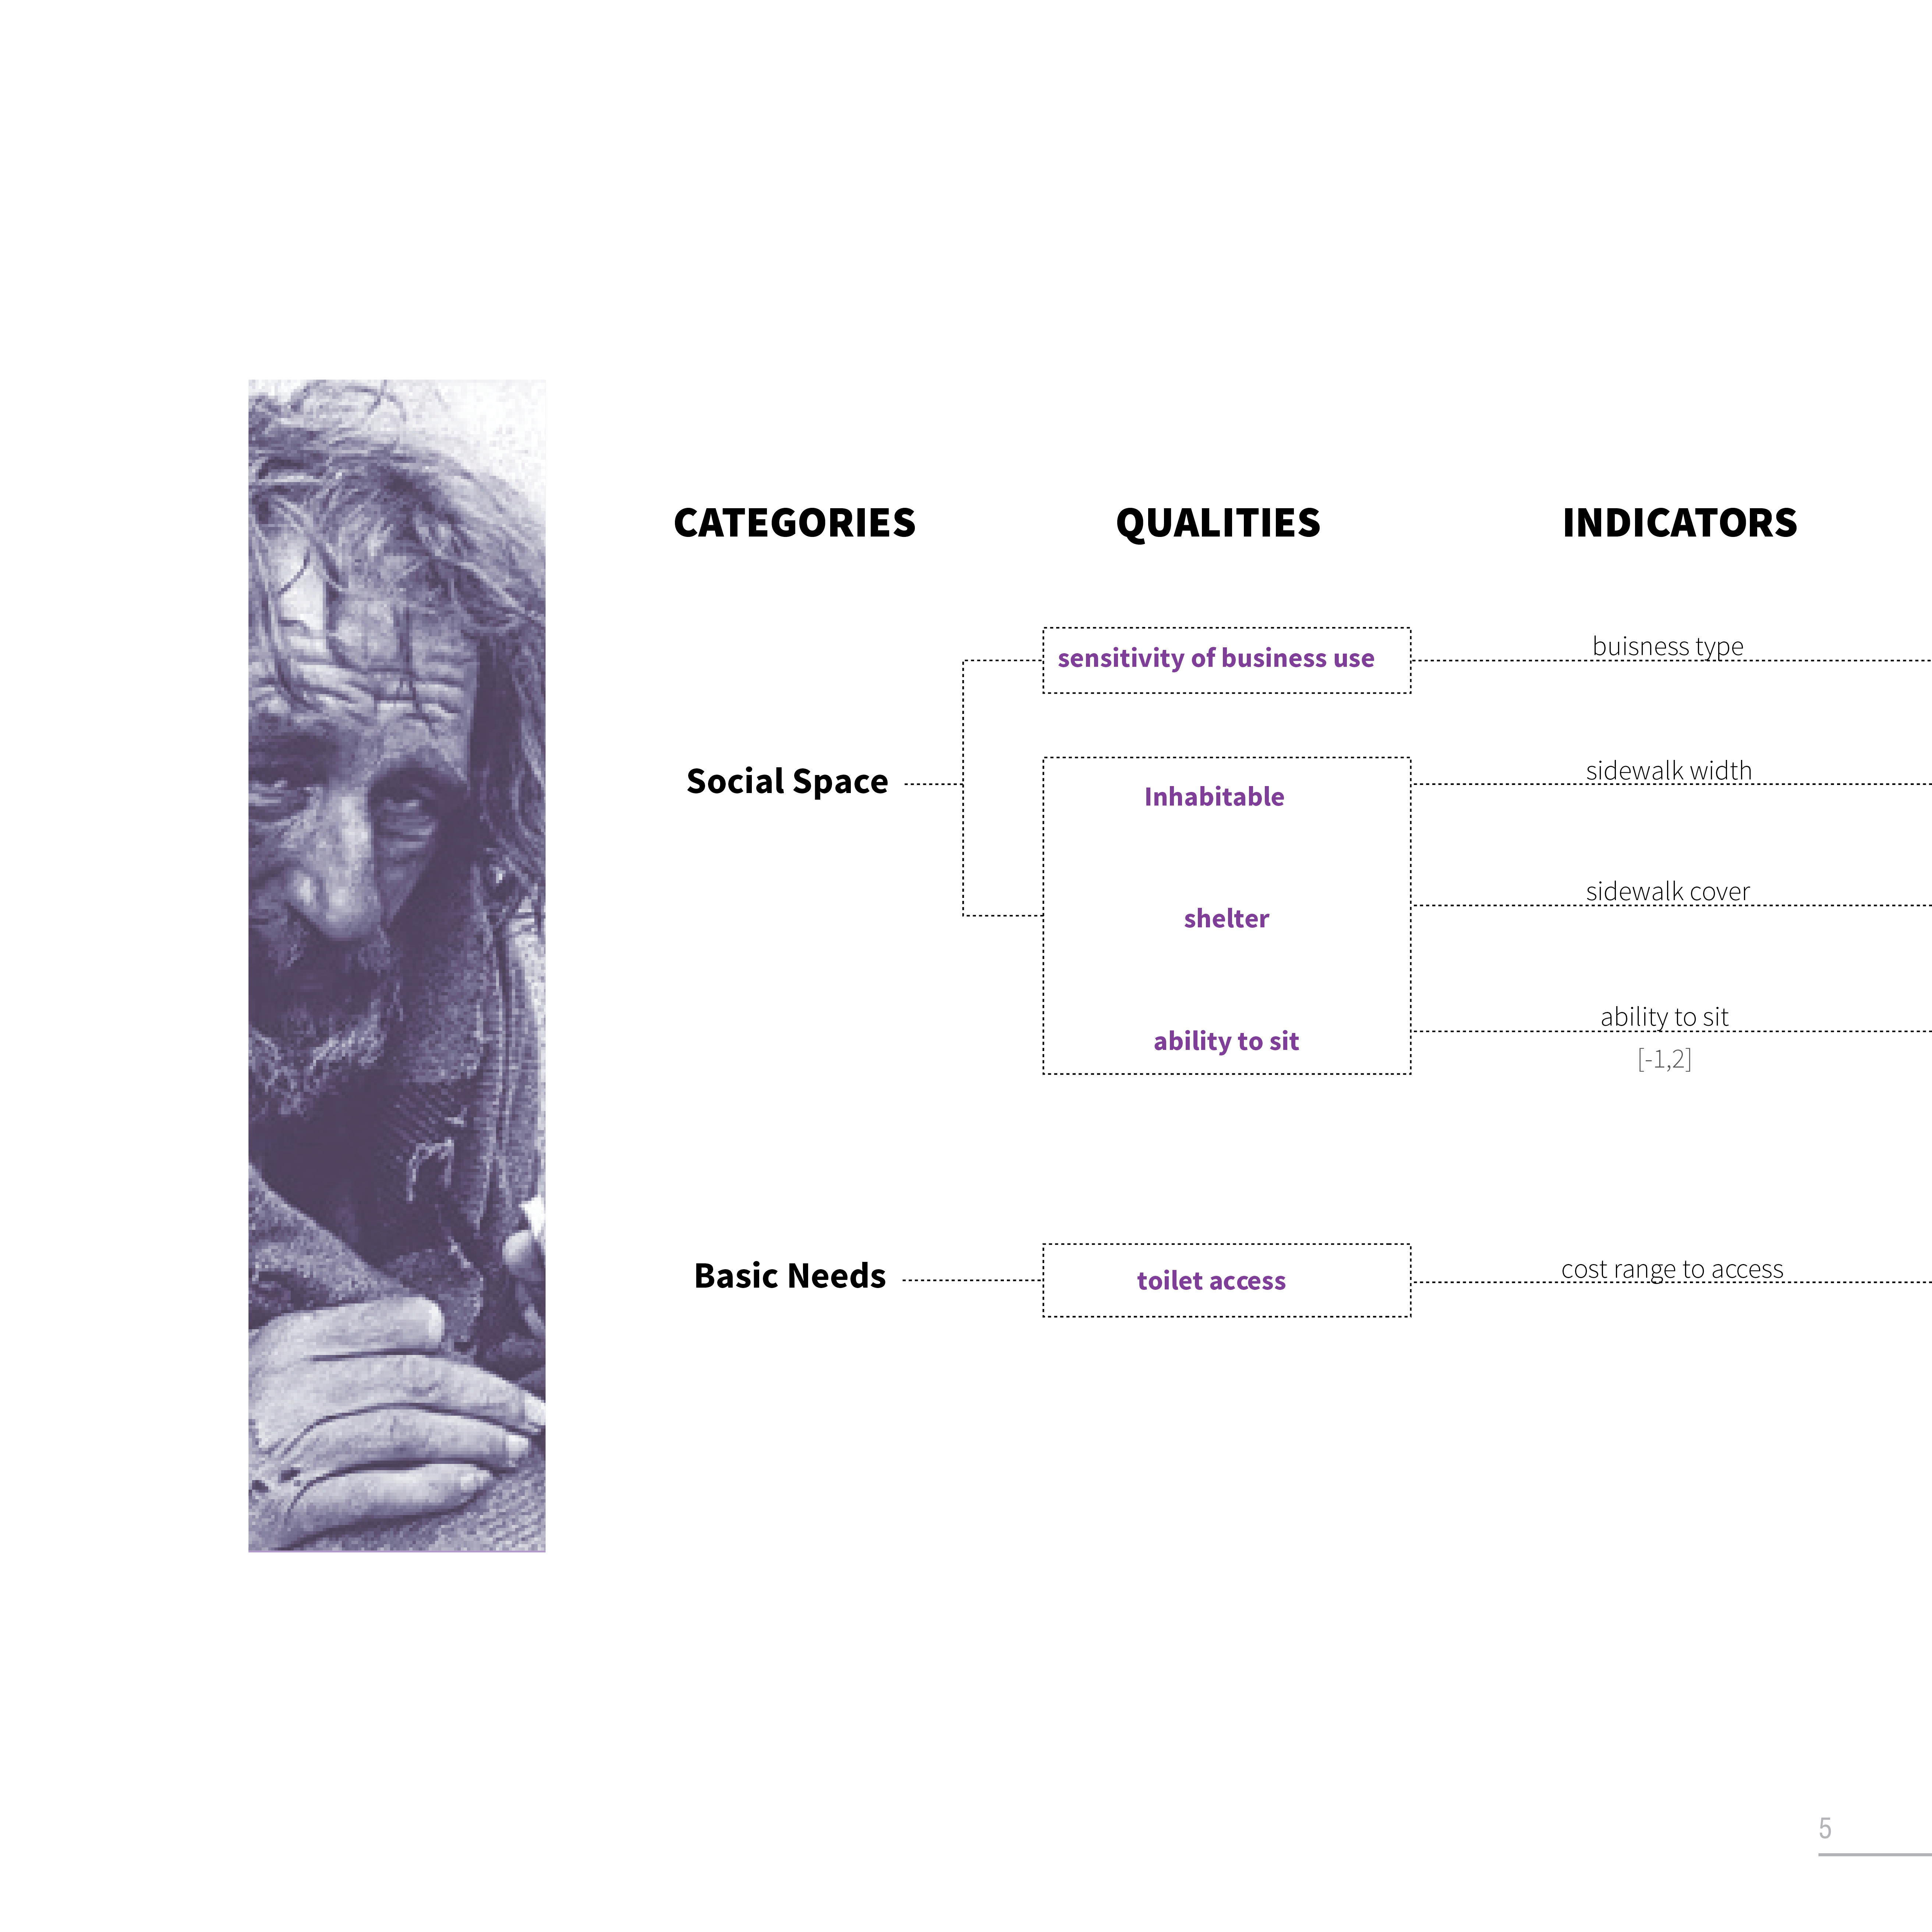
- Outline: Diagram and or Google Sheet of Purpose / Categories / Qualities / Indicators (history) / On-site or Off-Site / Fixed or Phenomena
- Literature Review: (3) quotations of theory / reading (Password: Barcelona). **Address ideas from the reading that include: downtown urbanism; Latour’s idea of attachment; Morales’s ideas on how the Eixample Plan Cerda works; Corner’s idea of adaptability with specificity; Jacob’s idea of unpredictability; Schartz’s idea of scenarios; Guallart’s idea of self-sufficiency (post); Jan Gehl’s ideas of walkability (post); or other ideas from the readings.
- Research Superilles and current Barcelona health and livability problems/challenges: 1- 3 recent articles as quotations or informational statistics (El Periodico, El Pais, other) (FYI, City of Barcelona is Ajuntament de Barcelona; Catalan Government is Generalitat).
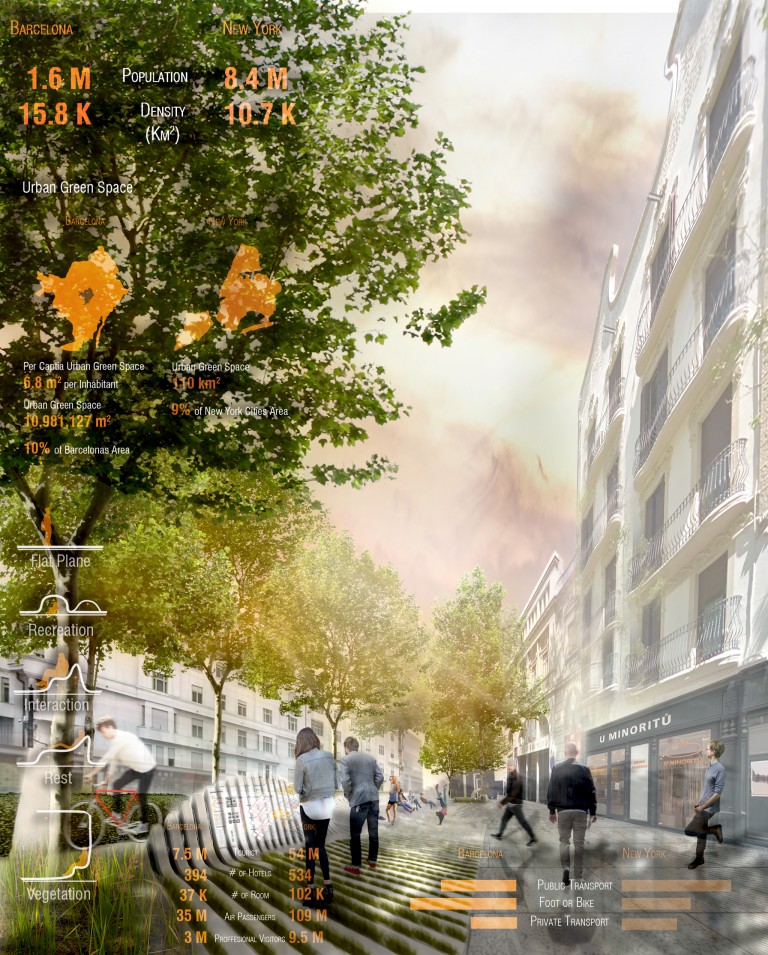
- Comparative Statistics: Infographics to set a quantitative baseline big picture to small picture indicators to follow. Research climate information by month or season such as precipitation, temperature highs and lows, relative humidity, wind direction and speed, animal migration. Research effects of human behavior such as sources of sound pollution (discos, tourists, terraces, schools), air pollution (terraces, construction, restaurant hours), light pollution (cars, commerces).
4. BACKGROUND: Quantitative and Qualitative Baseline (statistics and info-graphics)
-
- Qualitative media: picture (zoomed in) of your urban design characteristics (criteria)
- Abstract scientific data: measurement of basic relationships, statistics related to measure quality (ex. 6:1 water to urban farming recommendation). Abstract and Baseline models. Ex. Cost of water Barcelona / Granada. Ex. Overnight temperature difference, humidity, income per capita, etc.
- Policy Context: Catalan/Barcelona/ 22@ 10/10/10, BCNecologia_Presentacio Superilles, Patrimonio (Generalitat/Ajuntament) vs comparative city such as Portland, Madrid, EU. Can you find relevant law or ordinances in Barcelona, Catalunya, Spain or the EU
- Ecology: Bar charts and graphs may also be helpful, especially for quantitative contextualization.
- Sensors (on-site): What sensors might be helpful? +Find online an example with script and prototype diagram.
- Real-time Data (off-site): What databases exist?
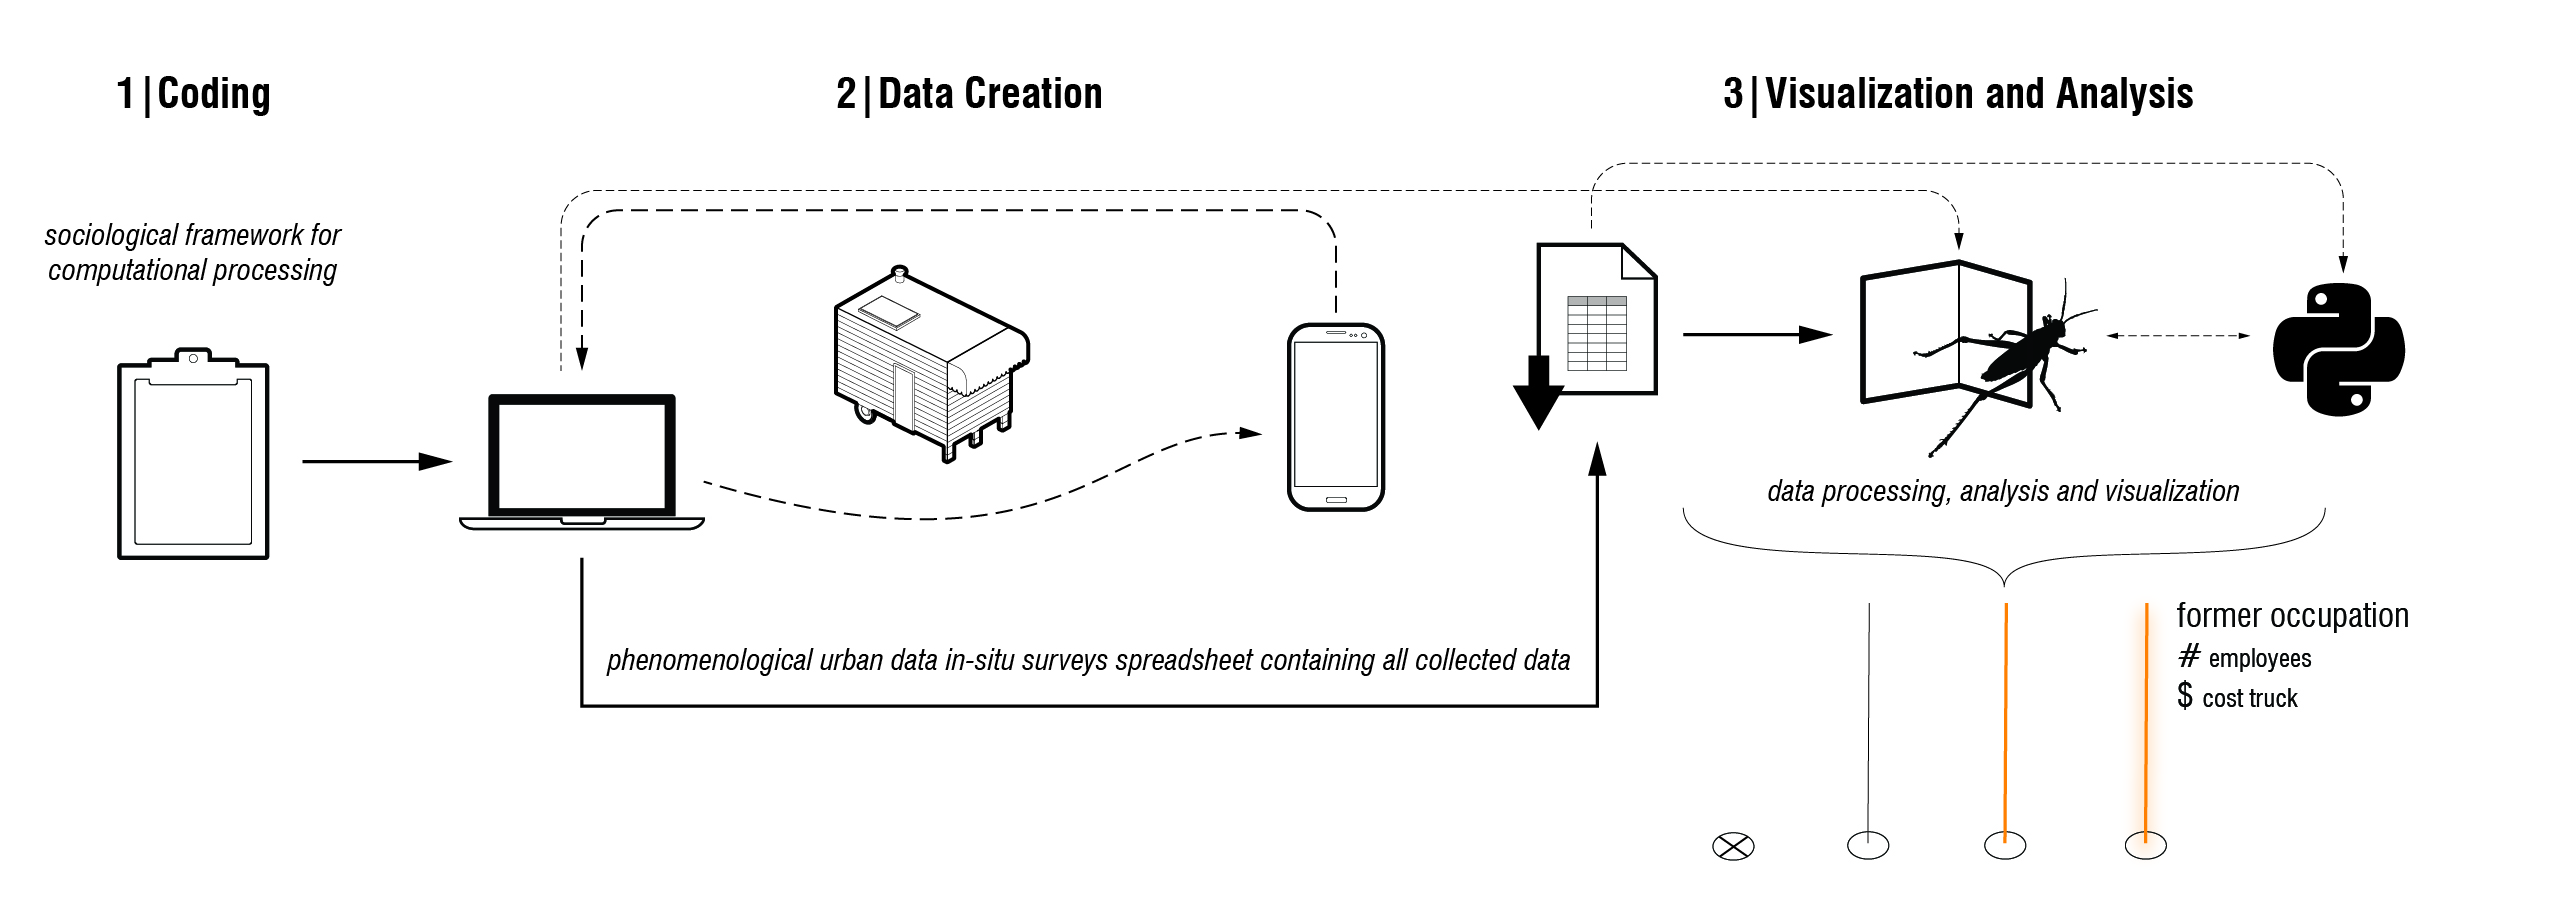 Figure above, Stephen Maher’s Diagram for Elephant tool and Food Cart / Food Truck Study Portland and New York.Data dimension: accessing urbandata and making it accessible,
5. METHOD
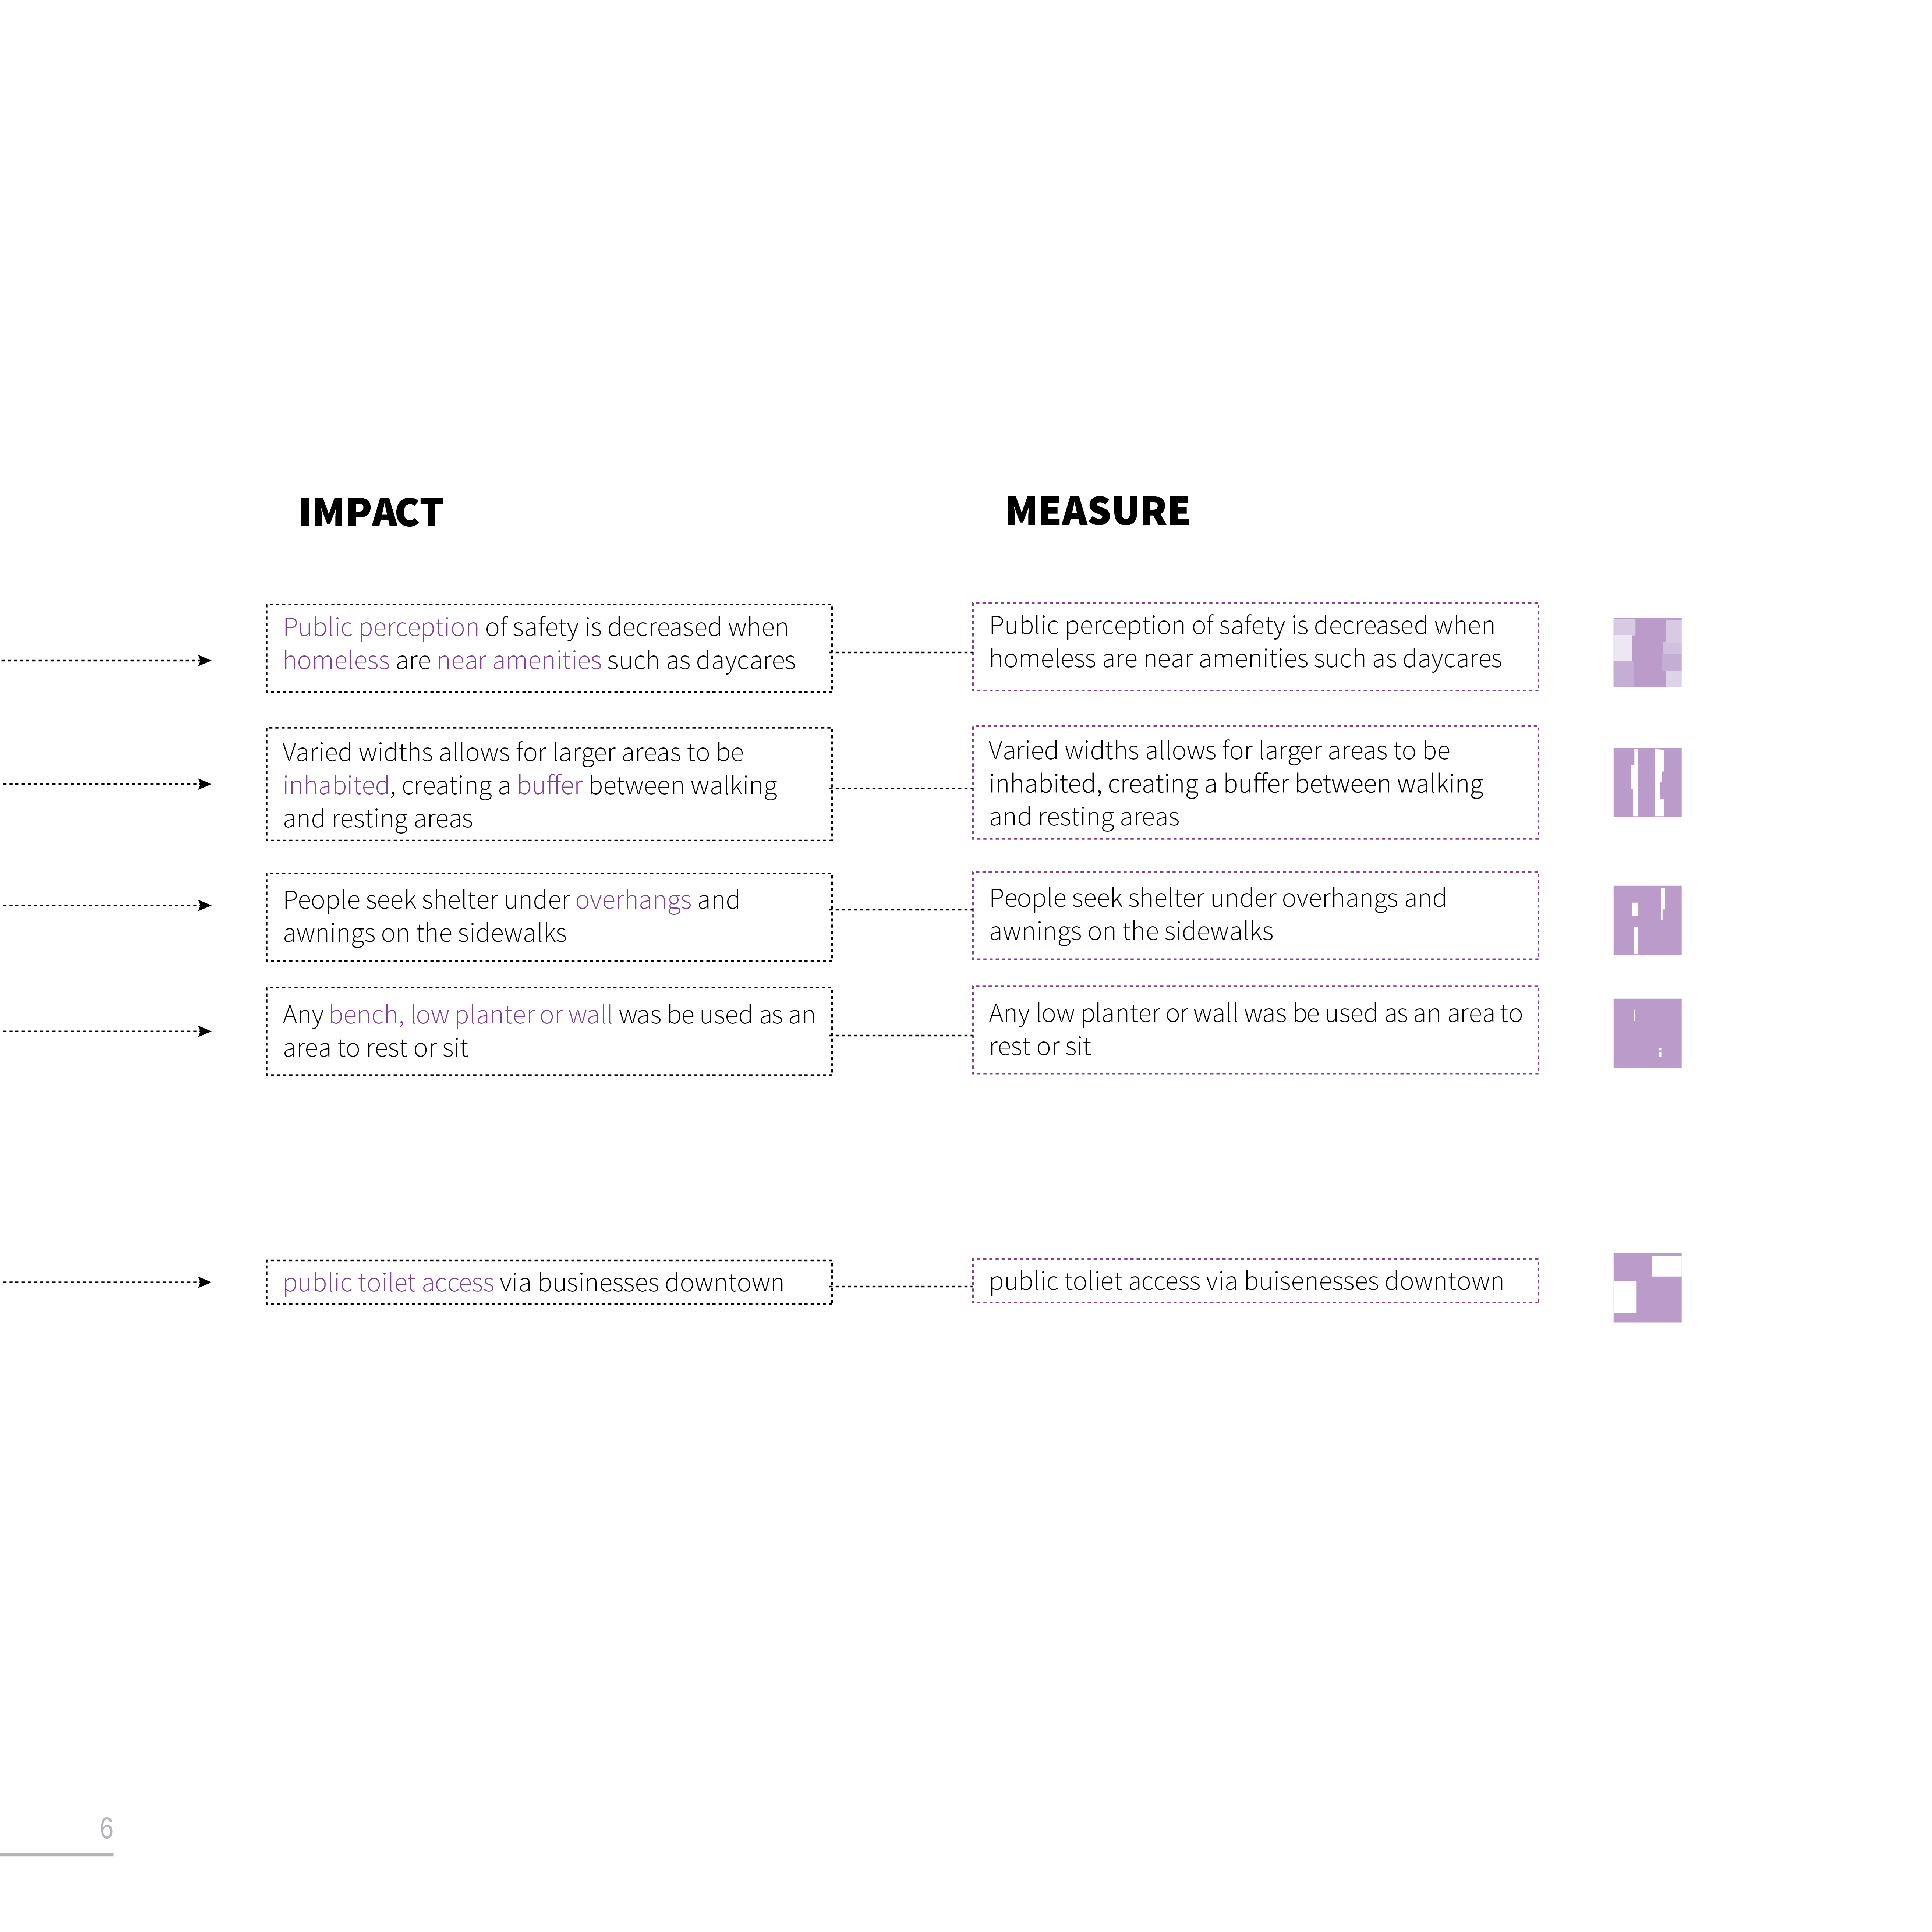
- Workflow Diagram : Categories, Qualities (history), Indicators, +Data Dictionary Descriptions, +Numerical Coding, Impact, Measurement, Thumbnail Diagram and or Icon.
.
GRANADA
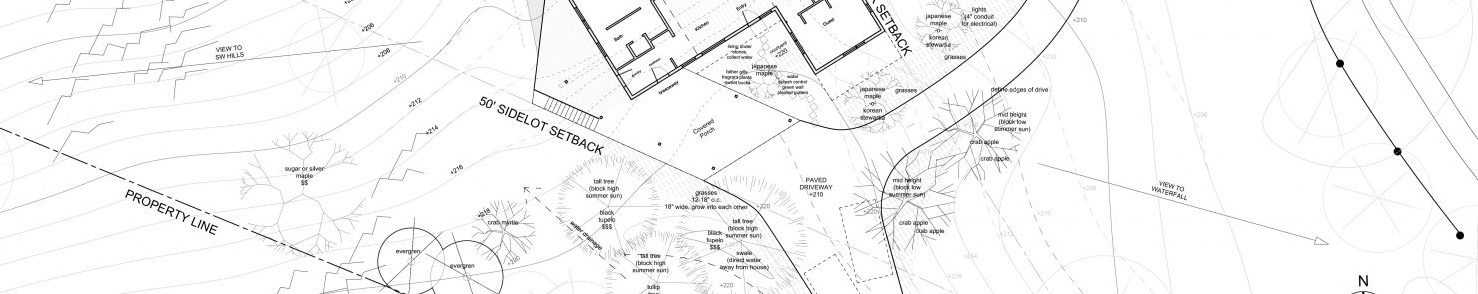
Location Plan, Neighborhood plan, Placeta Plans
Alhambra baseline observations (here or later)
BARCELONA
Unit Module Diagram
- Diagram a base primitive geometry unit approach: Intersection and Street
- Within the unit, create a module diagram testing the location of the indicator data: water catchment, air quality area, zoning use, street-level shop use, street trees, shrubs, running paths, exercise space, bike share station, metro station entrance, etc.
Diagrammatic List of Urban Characteristics / Indicators
- In-situ, 6-8 (indicators), Icons
- Off-Site, 2-4 at the small scale of 33m data point. Examples include: water collection, air pollution source, school, market, water source, etc.- found via municipal, digital, Yelp, Google), Icons
Barcelona Study Area
Eixample Esquerra
- Propose your selection in the designated 3 x 3 Superilla between Carrer de Roger de Flor and Carrer de Sardenya and Carrer d’Arago and Gran Via de les Cortes Catalanas . (see superilles map at BCNecologia_Presentacio Superilles)
- Poblenou Superilla.
- Exemplary Baseline Comparison area (Gracia, E. Granados, Alhambra, Pati Aigua, Joan Oliver, etc)
7. Location Plan : locate your study area superilla in Barcelona (see Guallart drawings)

(*control edges, consider raster background image at special areas in the neighborhood plan such as waterfront, green spaces or other spaces related to your Purpose Statement). Consider highlighting the Barcelona Superilla plan.
- Unit Module Diagram: Street / Intersection and Point Location at Sidewalk Unit (axonometric or plan) (Example, water catchment, air quality area, zoning use, street-level shop use, street trees, shrubs, running paths, exercise space, etc.)
8. Urban Qualities Comparison
Individual Qualities/Indicators: Unit Axonometric Diagrams, Plan and Icon
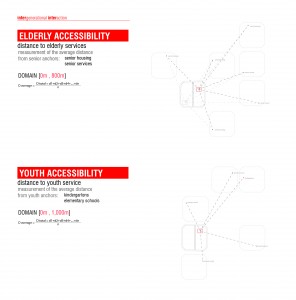
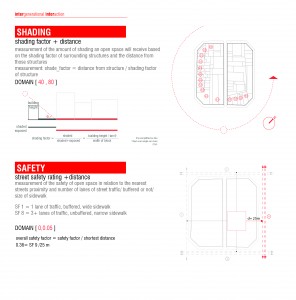
Plans (1-2 per page)
- Quality / Indicator / icon / axon highlighting condition 1
- Quality / Indicator / icon / axon highlighting condition 2
- Quality / Indicator / icon / axon highlighting condition 3
- Quality / Indicator / icon / axon highlighting condition 4
- Quality / Indicator / icon / axon highlighting condition 5
- Quality / Indicator / icon / axon highlighting condition 6
- Quality / Indicator / icon / axon highlighting condition 7
- Quality / Indicator / icon / axon highlighting condition 8
Landscape Catalog Timeline: Photograph and catalog materials.[05.1 Ecology: Atmosphere, Animals, Vegetation, other Catalog]

Circle Diagram/s of Selected Superilles and Streets

Baseline Comparison Area
- Data Collection and diagrams for Exemplary Baseline Comparison areas in Barcelona and off-site in Urban Qualities locations (Examples from 1. Maritime Metropolis, 2. Modernisme, 3. Granada Cultural Comparison, 4. Pluralisme, see Google My Maps)
- Explain why important. Comparative circle diagrams and highlight differences with images and programming text.
COMPOSITE DRAWING: compose various scales of previous drawings including Superilla, street, point data sidewalk diagram, abstract diagrams, timelines, material swatches.

URBAN DESIGN INTERVENTION
- Street Level Perspective of Human Experience: Initial surreal collage highlighting the urban phenomena
- Design Strategy Description: Findings from Sentence and or bullet points
- Measured Drawings: 2D plan, section, and details


**include numerical data in all drawings!
- Time-based Spatial comparison: create a GIF/s and consider how this information may be made accessible in public sosce
- Dynamics: What is the timeline of the information update?
- Persona: Identify and describe users
- Responsive ecology – everyone should try a responsive design via remote sensing of people or nature.
