

ASSIGNMENTS: 01A DIAGRAMS AND 01C WRITING


Time, Material, Location + Phenomenological Data:
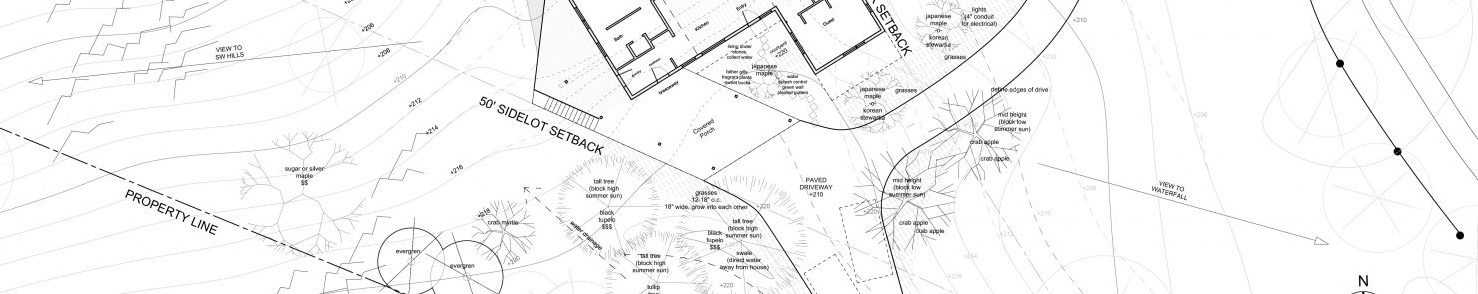
Compose the following four information for the Sarria park along Parc de Joan Reventós – Viquipèdia in one drawing for Monday. Use the James Corner ‘Planting Calendar’ below for reference to relate (white instead of black background – MOSTLY LINES). Find a geometric and drawing language to RELATE the following degrees of information:
Location (plan)
Material (texture examples above)
Time (Observed phenomena in-situ)
Time Data 1, Test on-site mobile phone sensors (3) via apps: gyroscope, light meter, sound meter, sound app, etc
Time Data 2, Test off-site data (online): rain, humidity, wind, cloud cover, anthropological events such as school hours, cultural festivals, pollution levels, fowl and fauna ecology timelines. Example, label an axis for months of the year or week and superimpose a graph below, above or behind your drawing. See Real-Time Data Mining. (Example website http://airqualityegg.com/)
Data (Measured Air, Water and Soil Groundscape)
Name one quality and two indicator methods to measure it (one low tech and one high tech Arduino sensor – identify/name only) for air, water and soil. Indicators are not direct measurements about a desired quality. The following reading may help you understand the methodology Social Interaction Cohesion Tool_ACADIA 2015.
Website Category: [01A Diagramming]

James Corner, Planting Diagram

Charles Minard’s map of Napoleon’s disastrous Russian campaign of 1812

Christo and Jeane-Claude, Over the River (Upper Left: LINES ON BACKGROUND. White is fine)
Differentiate. Push to 4th degree diagram: 1) diagram; 2) differentiate; 3) pattern emerges (turn background off)…you have generative tool; and 4) change pattern as design tool

diagram, first differentiation


OMA, Rem Koolhaas, diagrams, Seattle Public Library and Carbon Footprints

l|c|a:BCN 2011, student Ida Yazdi (time and material only)
.
“Urban Processes and the Human-Scale: Measuring social interaction at pedestrian-scaled Superilles in Barcelona, Portland and Eugene,” // writing assignment, 3 paragraphs
1. Describe the general theoretical framework evolved from Salvador Rueda about Social Interaction and Cohesion (use, infrastructure, demographics). Consider going to the website BCNecologia but only for background – you will not find specific information to this there.
2. Describe two to three urban qualities within the primary social interaction categories and find how they are measured in the circle diagrams. Identify an associated ecological phenomena such as air, water and heat/light.
3. Describe one example of a pattern that emerged in Barcelona relating a comparison between a Superilla and a comparative space such as Gracia or Enric de Granados.
[01C Writing]