In looking at various charts of a sample company with inventory, shipping, type of product, etc. we deducted some information about the companies sales. When looking at all of the data it was a bit overwhelming, over 8000 lines of data! In order to better grasp what the information was telling us about sales we singled out certain aspects of the products being sold in order to see how sales were effected in these various segments.
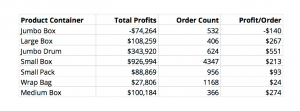
The first variable we looked at was the product container. We wanted to see if there were more larger product containers being sold for profit or smaller product containers. After analyzing the data we found that the most overall profitable container size is the Small Box with a total of $926,994. This is probably due to the fact that people are most likely buying small products from the office supply store in person. In terms of making the most profit per order on average, the Jumbo Drum was at the top.
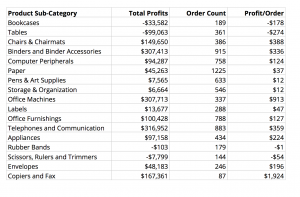
Another variable we looked at closer was the product sub-category in order to see what products were selling and which were not bringing in profits for the company. It appears that the company is making the most on copiers, fax machines, and other large office machinery. This makes sense as these orders will likely have a higher price tag and thus the company will make more per unit sold. The company is losing money on bookcases, tables, and scissors, rulers, and trimmers. All of these profit numbers are in the negative. If you were this company you would want to look into these products that were struggling and see what could be done to boost profits whether that is advertising, sales, limiting product orders, etc.
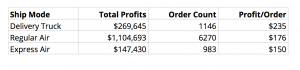
A third variable that we looked at was the shipping mode and how that impacted sales. The company is making the most/order on those items being shipped via delivery trucks. This is likely due to the fact that this is the most cost effective option for consumers and also highly available option for the company. The regular air shipping while having a remarkably high total profits of $1,104,693, the profit per order was less than that of the delivery truck. We believe this is because it is harder for the company to coordinate air shipping and people are less likely to ship a commodity good a long distance. If someone needs office supplies, they are likely to go to the closest office supply store and pick up the goods.
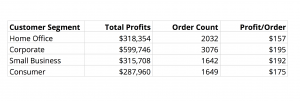
The final variable that we looked at was the customer segment. Not surprisingly, corporate and small businesses are where the company makes the most profit per order. This makes sense because these are entities that will have a constant need for office goods. These groups are also likely to order more copiers, and larger machines which were the products that were most profitable.