Analysis and Observations
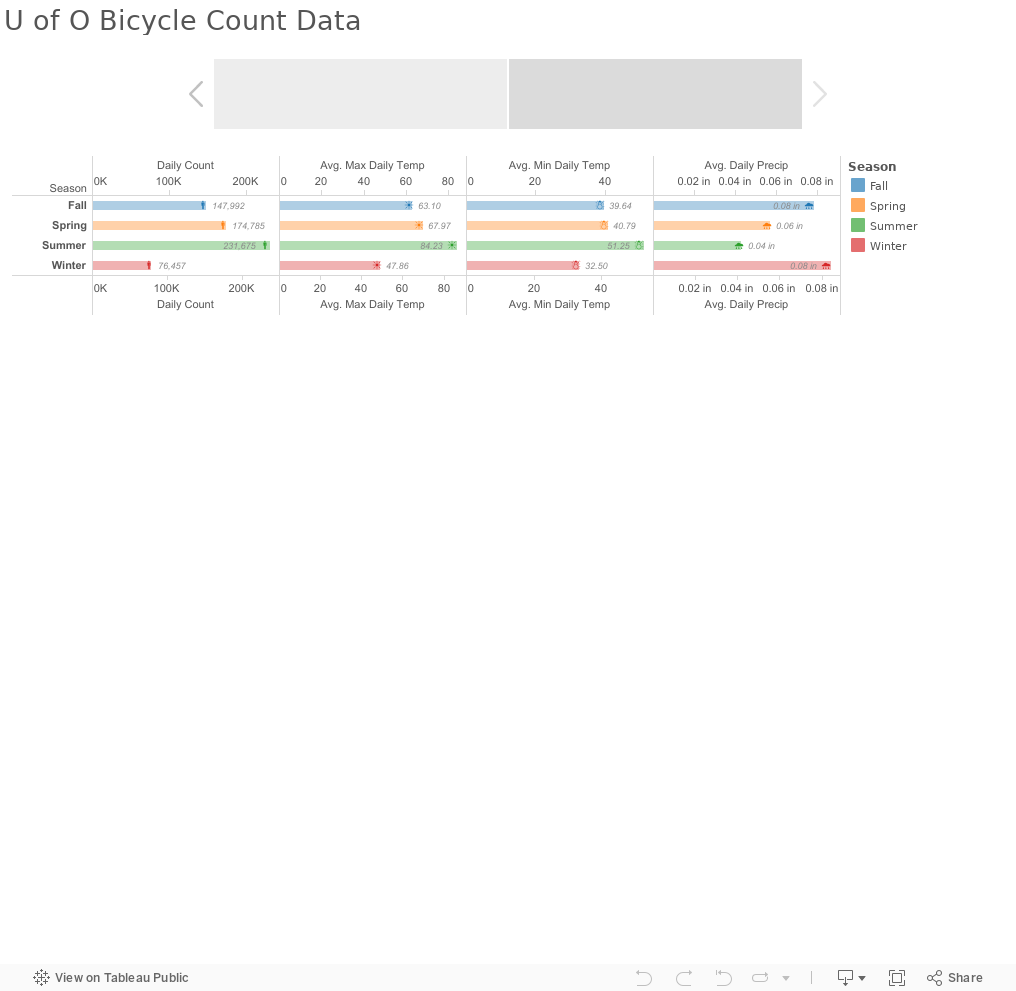
U of O demand data doesn’t show a correlation with count data. This is probably because Lane Council of Governments (LCOG) counts capture more than just U of O commuters. Environmental data appears to have more of an influence on count data. As the seasons become drier and warmer, bike count increase.
Sensor Description
Bike count data was collected by LCOG using 4 portable tube counters. Rubber tubes are placed over the facility and triggered when a bicycle applies pressure to the tube as it is crossed. These counters are specifically designed for counting bicycles in a variety of settings where both bikes and motor vehicles are present.
Scale
Using a seasonal scale for displaying the data seemed to be the most logical choice since the data was sampled and so much time elapsed between samples.
Tableau Story
Below is a story board made using Tableau Software