speranza@uoregon.eduMarch 5, 2015 at 5:28 am · Reply →
Good work.
I can see that you are having no trouble with Elk to bring in new information- geometric in nature.
Some points which could be clarified:
– what are the final indicators? can you have an icon and or swatch sample image for each?
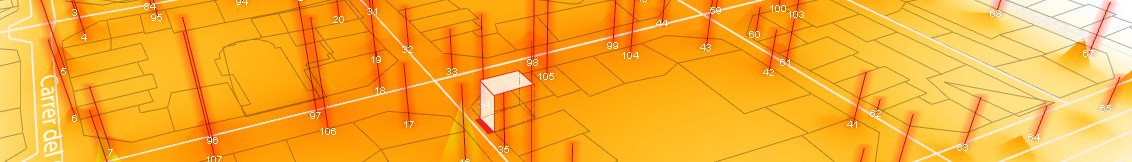
– the 3D images are useful but could use refinement. They can be simple and abstract but they seem too loss. CAP the tops of volumes. What is the cylinder? Maybe the perimeter wall of the block is too overwhelming. consider dashed lines for hidden ideas / elements. Maybe the 3D modeled blocks need more detail, a higher view down, etc.
– Is there a sample block you are using as a model?
– Info graphics could still use some more pop. what is the clear comparison for contextualization? Maybe some numbers are much bigger and side by side for comparison? you have some very good BCN data but we might need something similar to Portland to understand its significance?
– Your final output of the diagram is useful. it might be useful to see it side by side for two blocks / intersections, maybe an aerial 3D from Bing and the respective diagram for each block.
– You may wish to ask Stephen how to pull building or other information from OSM if it is helpful.
– Some findings / conclusions might be nice. you seem to have some a great deal of research and analysis. why do you think the emergent patterns happen as they do?
Good work. Keep going. Im sure it will take a strong final direction.


Good work.
I can see that you are having no trouble with Elk to bring in new information- geometric in nature.
Some points which could be clarified:
– what are the final indicators? can you have an icon and or swatch sample image for each?
– the 3D images are useful but could use refinement. They can be simple and abstract but they seem too loss. CAP the tops of volumes. What is the cylinder? Maybe the perimeter wall of the block is too overwhelming. consider dashed lines for hidden ideas / elements. Maybe the 3D modeled blocks need more detail, a higher view down, etc.
– Is there a sample block you are using as a model?
– Info graphics could still use some more pop. what is the clear comparison for contextualization? Maybe some numbers are much bigger and side by side for comparison? you have some very good BCN data but we might need something similar to Portland to understand its significance?
– Your final output of the diagram is useful. it might be useful to see it side by side for two blocks / intersections, maybe an aerial 3D from Bing and the respective diagram for each block.
– You may wish to ask Stephen how to pull building or other information from OSM if it is helpful.
– Some findings / conclusions might be nice. you seem to have some a great deal of research and analysis. why do you think the emergent patterns happen as they do?
Good work. Keep going. Im sure it will take a strong final direction.