Project Assignment Update
Please post as [04 Project Draft] for Tuesday
TEMPLATE
Please use the template on the Google Drive and the outline below. The pages are Supersquare 8.5 x 8.5 (8.75 x 8.75 for full bleed trimming in Lulu). Although we will print full breed please keep important content 1/2″ away from the 8.5 x 8.5 edge. I’m also happy to discuss independent study and or joint writing opportunities with work. There are moments of very advanced research in the work.
.
SPREAD I (printed to 11″ x 17″, landscape)
Page 1 (left page, 8.5″ x 8.5″) Title and Authors
- Title: two words
- Authors
- Icon/Image (later)
Page 2 (right page) INTRODUCTION: Purpose to Problem (thesis),
- Objective (Project Purpose Paragraph): What is the purpose / problem related to social interaction and Superilles; who does it affect (be as specific as possible); Why is it important; (highlight key words)

- 3D unit diagram with geospatial variables, Choose 1-2 (parcel area, height, sidewalk width, rail, bike, waterway) Hint: see OSM/ELK
- Qualitative images: Zoomed-in small thumbnail or narrow texture of swatch of qualitative image/material perhaps hinting at final output. Example: seating, play, eating,
- Social Interaction and Cohesion Tool Diagram with highlighted primary (Social, Demographic and Infrastructure) and 2 secondary categories. List Urban Qualities and indicate if each is a physical urban characteristic or a an urban phenomena.
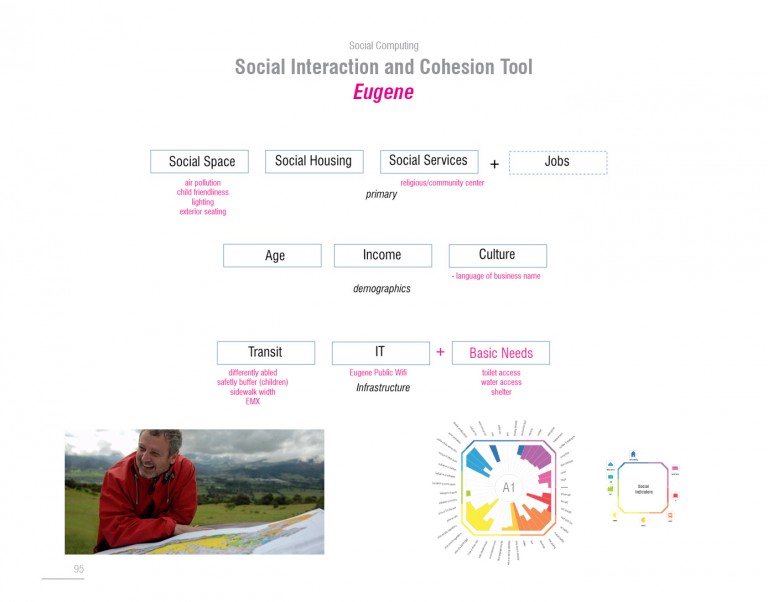

- **visual notes– quantitative method, develop visual language of the qualities to measure and compare parametric variations. Set the tone for the unit and highlight color here.
SPREAD II
Page 3 (left page) BACKGROUND (Contextualization)
- Literature Review: Theory of Urban Design related (1-3 quotes)
- **Address ideas from the reading that include: bottom-up urban design; Latour’s idea of attachment; Morales’s ideas on how the Eixample Plan Cerda works; Allen’s idea of the field condition; Corner’s idea of adaptability with specificity; Jacob’s idea of unpredictability; Schartz’s idea of scenarios; Guallart’s idea of self-sufficiency (Post); Jan Gehl’s ideas of walkability (post); other ideas from readings
- Research Social Interaction and Superille / Eugene/Barcelona problems: 1- 3 recent articles as quote or informational statistics (Register Guard, Eugene Weekly, El Periodico, El Pais, other) (citations)
- UO Case Studies and or Plugins (optional)
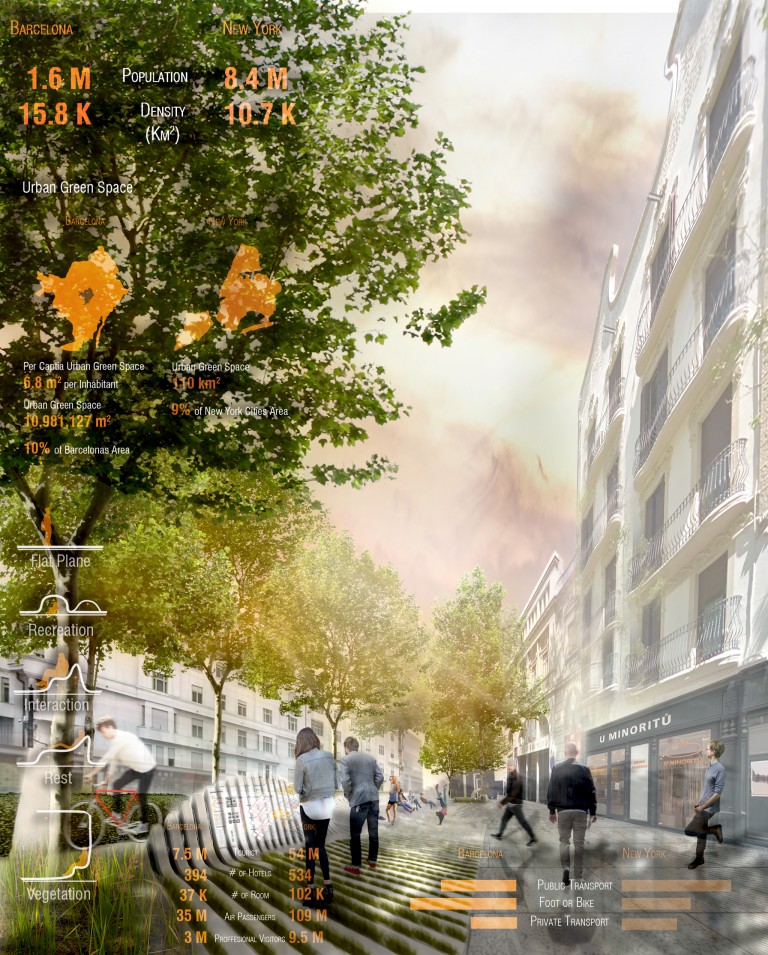
- Comparative Statistics: Infographics begin here and continue to next page
-
- EUG / BCN / PDX (compare to Portland ), big numbers and %’s.
- Laws governing your project (USA, Oregon, Lane County, City of Eugene) (EU, Spain, Catalunya Generalitat, Barcelona Ajuntament)
- Diagrams- visualize/organize relationships of your ideas in degrees of time, material, space and real-time data
- Bar charts and graphs may also be helpful, especially for comparison.
** graphic hints: set quantitative baseline big picture to small indicators to follow.
Page 4 (right page) BACKGROUND: Quantitative and Qualitative Baseline (statistics and info-graphics)
- Qualitative media: swatches of your urban design qualities
- Abstract scientific data: measurement of basic relationships, statistics related to measure quality (ex. 6:1 water to urban farming recommendation). Abstract and Baseline models.
- Timelines: Identify time relevance in periods (hours, day, week, year, years) Material Landscape Diagrams (background data from Wiki, etc, redrawn) Documentation and then Analysis. Examples: Monthly rainfall in Eugene / Portland / Barcelona; annual cycle of London Plane tree; daily cycle of winds in Eugene / Barcelona.
.
SPREAD III
Page 5 (left page) METHOD (to be clarified)
- Study Block/Street and Eugene Superilla– Document one relationship at a time- the differences within the block.
- 3D Parti with External Force of New Dataset Information source: (citations perhaps with * # legend):
- On-situ Database Collection (CSV) from 108 point collection method
- Off-site Data (OSM and other) from Google Maps, Google Street View, Bing, Yelp, and other virtual sources off-site observation, OpenStreetMap.org, Resources – 22@ PDFs for zoning use and open space, GIS Shape files.

Page 6 (right page)
- Location Plan : locate your study superilla in Eugene / Barcelona (see Guallart drawings); GH Elk/OSM

(perhaps control edges, consider raster background image at selected areas of your project such as waterfront, green spaces or other more creative types of spaces)
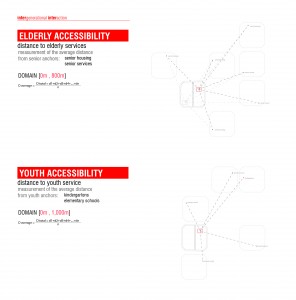
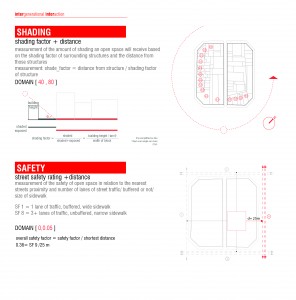
- Data Dictionary: Purpose / Urban Design Criteria / Indicators…Measurement translations (number, types and or rating systems); GH Leafcutter alt to CSV

- GH GIS Analysis (blend, point, line tools) and post-processing, citing any GH plugins, Identify possible plugins to learn including HUMAN, ELK, LUNCHBOX.


SPREAD IV
Page 7 (left page) METHOD
- Eugene / Barcelona study 01, indicators + heat map
Page 8 (right page) METHOD
- Indicator Evolution Diagram
- Final Indicators: Primary, 2-4 + Secondary, 2-4
.
SPREAD V-VI
Parameters (see II) examples…
Page 9 (left page)
- Parameter 1
- Parameter 2
Page 10 (right page)
- Parameter 3
- Parameter 4
Page 11 (left page)
- Parameter 5
- Parameter 6
Page 12 (right page)
- Parameter 7
- Parameter 8
.
SPREAD VII
Page 13-14 WORK FLOW / METHODOLOGY DIAGRAM
- Qualities Formula Diagram: Diagram of your Grasshopper Definition and Methodology

SPREAD VIII
Page 15-16 COMPOSITE DRAWING (see Cantrell Holzman)
- Sidewalk Unit Diagram: smallest unit of understanding
- Street Unit Diagram: Plan
- Superilla Aerial/ Plan Diagram: Findings, Emergent patterns (with leader, as notes, etc.)
- Circle Diagram?
- Model spaces: Identify 1 precedent urban rooms . The Whiteaker or DWNTWN EUG, Gracia plazas, San Joan, etc – Scaled plan 1:50 satellite view and urban room diagram, and section.
- Corner Collage Timeline: Catalog variations of affect (experience of qualities): 3D parti of external forces (street unit). (50/50 Ned Kahn), identify external forces, major overall ones including metro, parks, bike lanes, etc and relevant ones to your qualities. **Organization / Sequent of qualities over Timeline: (day, week, year, years).
 see other here


SPREAD IX
Page 17-18 (right page) URBAN DESIGN INTERVENTION + Mobile Application Interface
- Mobile or Situated Information Technology: Identify a dataset (could be live data like 01b Diagramming); include GH GIS mapping analysis image (z-line, circles, color blend) at the unit street / intersection and superilla; buttons for each phase of timeline; and physical situated technology design as kiosk (slab, post or other), lights in ground, etc.
- Dynamics: What is the timeline of the information update?
- Persona: Identify and describe users

- Design Strategy Description: Findings from Sentence and or bullet points
- Measured Drawings: 2D plan, section, detail, Corner collage (materials, time, place optional)
- Human Experience: Initial surreal collage and Perspective