Notes: Map may not be viewable in Firefox. (Firefox users, please navigate the lists below to view our research reports.)
Purple markers denote institutions surveyed in our first round of research.
We undertook more extensive research conversations with the four institutions marked in gold.
In addition to surveying the resources and services of the University of Oregon, InTRO was tasked with undertaking a broad analysis of digital education at a number of comparator institutions. Read on to learn more about our research process and the trends we observed, as well as to download our collected data.
Research Process
First Round: November 2014-March 2015
Methodology
Our initial research delved into the web presentation of digital and continuing education programs at each institution, accepting that the process, structures, and activities visible through their online presence may differ from the realities of the programs. Where possible, our summaries were checked against publically available analysis and reporting.
Research Questions
Our initial research questions were designed to cast a wide net, covering everything from online education efforts to technology-enhanced face-to-face courses, with a particular focus on organizational structures and pathways for faculty development.
- What services does this institution’s Extension unit provide to campus partners?
- Where is digital education housed? Are there separate units for online learning and blended or hybrid courses? Are technology and pedagogy combined or separate? How much of this effort is centralized?
- What structures, formal or informal, are in place to encourage pedagogical innovation on campus? Is there any effort to centralize such activity
- Where are instructional design and instructional technology housed? What pathways exist to guide faculty to instructional technology services? Is access to instructional technology support uniform across different faculty groups at the institution?
- At what administrative level are digital education initiatives, endorsed, supported, or made a fundraising priority? For example, does the institution count, encourage, or otherwise track student enrollment or participation in digitally-inflected (hybrid, blended, tech-enhanced F2F) courses? What institutional investments have been made in hybrid and/or blended learning?
Institutions Surveyed
We initially selected twenty-six U.S. institutions to research. This list of institutions was derived from multiple sources:
- The official UO comparators list
- Information Services’ unofficial list of IT comparators. This list focused on institutions with a similar scale of technological infrastructure and needs.
- Other former members of the Oregon University System, particularly known innovators or institutions of comparable size
- PAC-12 schools providing continuing education or online course delivery on a large scale
Click on any institution to read our initial report.
Group A: Official UO Comparators
- Indiana University [PDF]
- UC Santa Barbara [PDF]
- University of Colorado, Boulder [PDF]
- University of Iowa [PDF]
- University of Michigan [PDF]
- University of North Carolina – Chapel Hill [PDF]
- University of Virginia [PDF]
- University of Washington [PDF]
Group B: Unofficial IT Comparators
- Auburn University [PDF]
- Colorado State University [PDF]
- Iowa State University [PDF]
- University of Connecticut [PDF]
- University of Massachusetts, Amherst [PDF]
- University of Missouri [PDF]
- University of New Mexico [PDF]
- University of South Carolina [PDF]
- University of Tennessee [PDF]
- University of Utah [PDF]
- Virginia Commonwealth University [PDF]
- Washington State University [PDF]
Group C: Oregon University System Peers
- Oregon Institute of Technology [PDF]
- Oregon State University [PDF]
- Portland State University [PDF]
Group D: Selected PAC-12 Schools
- Arizona State University [PDF]
- UC Berkeley [PDF]
- UCLA [PDF]
Second Round: May-June 2015
Methodology
Our second round of research was conducted via conference call. We selected four institutions–3 standouts from our initial reporting, and a fourth on the basis of a presentation at a national conference. All four institutions had reorganized internally to promote a more cohesive vision of that institution’s work in digital education, providing us with four potential models we thought would be of most interest to the greater University of Oregon community. Each call involved multiple staff members from both the University of Oregon and the model institution.
Staff at the model institution were provided with our first round of reporting prior to the call. At the beginning of each call, they were asked to confirm the accuracy of our research, and to make note of any unintentional omissions. The rest of each call was structured around three research questions, below.
Research Questions
Our second round of research questions targeted each institution’s understanding of how change had come about, as well as how the new structures in place at their institution were sustained.
- What was the impetus or incentive for the growth of digital education at your institution?
- How did your institution manage the concomitant cultural shift, in terms of people/relationships, resources, and policy?
- What budget model have you implemented, and how did you decide upon it?
Institutions Surveyed
Click on any institution to read our “deeper dive” report.
- Iowa State University, Center for Excellence in Learning and Teaching/Office of Online and Distance Learning
- University of Illinois, Center for Innovative Teaching and Learning
- University of Michigan, Office of Digital Education and Innovation
- University of Missouri, Mizzou Online
Third Round: July 2015–
Methodology
We are continuing to analyze additional institutions, using our first-round overview method as a starting point, and following up with second-round interviews as appropriate. We will continue to update this section and our map as we expand our research efforts.
Institutions Surveyed
- University of Arizona [PDF]
Trends and Observations
Progressive Visions
Of our 26 comparator institutions, we felt that only one, UC Santa Barbara, was not “ahead” of UO’s own efforts. On average, we found our comparators to be 4-6 years “ahead” of us in terms of program development and innovation in digital education. Arizona State, Oregon State, UC Berkeley, the University of Washington, and Colorado State were all 7-9 years “ahead,” with the e-campus models in place at the Universities of Missouri and Massachusetts seeming to be a decade or so “ahead” of where we are today. More realistically, institutions such as the Universities of Iowa, New Mexico, North Carolina, and Connecticut, as well as UCLA—all 1-3 years “ahead” in our estimation—offer examples of niche program development or “turnaround” efforts that could be of value to UO in the future.
Note: Institutions “ahead” of UO in our comparator research are generally following a strategic vision tied to planning, objectives and resource management.
Online Degree Offerings
UO offers fewer online degrees than all of our comparators; notably, we have not yet gotten into the graduate certificate market, while 25 of our 26 comparators have done so.
Essential Services for Learning
UO is the only institution in this comparator research which houses the learning management system (and academic technology services in general) within the library. While this is not uncommon at smaller institutions, especially liberal arts colleges, it is atypical for a university of our size and research focus. Of the institutions studied here, 19 place responsibility for the LMS in the central IT unit. 1 institution is moving LMS administration out of central IT to an educational technology unit, in conjunction with a transition from one LMS to another. At the remaining 6 institutions, the LMS is administered by an independent educational technology unit. Often, this reduces the ed tech unit’s focus to little more than the basic use and maintenance of that system; 4 of these 6 are not producing significant innovation in digital education courses and programs. Of the other two, UC Berkeley has a number of innovative programs and offerings, but does demonstrate a lack of equal support across campus units, and Utah has a large number of online offerings aimed at their campus population.
One emergent issue at UO that is shared by many of our peers is the need to implement a second learning management system for non-credit education. While a number of institutions–particularly those facilitating fully online degree programs or certificates–have managed to find a single vendor product that can be configured to support all parties, at least one institution was in the process of attempting to merge non-credit courses with credit courses into a single LMS, and several expressed a desire to merge the two, many continue to administer separate systems for degree-seeking students.
Finally, issues of policy in relation to the use of the learning management system need to be thoughtfully considered, with input solicited from all faculty and staff stakeholders. Particularly significant are the multiple ways instructors have other people engaged in their courses’ LMS presence; this might include program directors, course builders/instructional designers, guest lecturers and co-instructors, student add-ons (grad students in undergraduate Canvas sites, for example), enrolling students who need immediate access, distance students with unique registration challenges, or non-credit users (as described above). While there are legitimate issues of access, privacy, and compliance to address, usage policies ought to reflect an understanding of the learning necessities faculty are trying to address.
Administrative Mandates and Grassroots Inspiration
In our first round of research, we noted that a large number of institutions surveyed implemented digital education initiatives as a result of “top-down” decision making at the administrative or even legislative level–a total of 21 of the 26 institutions were operating under either an internal or external mandate. But our second round of research confirmed a theory: that at least in some cases, goodwill for that public leadership was due to preceding years of grassroots innovation. While our numbers suggest the importance of a clear vision for digital education among senior administrators and faculty, one that begins at the top of the pyramid and trickles down to the local level, innovative efforts at the local level must also be publicized and supported in order to create lasting campus cohesion.
Enabling Cultural Shifts
Multiple presentations at the recent UPCEA centennial conference made clear that a number of well-established, high-quality digital education programs struggled through periods of confusion in order to adjust towards technological innovation. These same presentations, however, universally stressed the value of strong administrative leadership and a clearly defined academic mission in the development of innovative initiatives.
Comparator Data
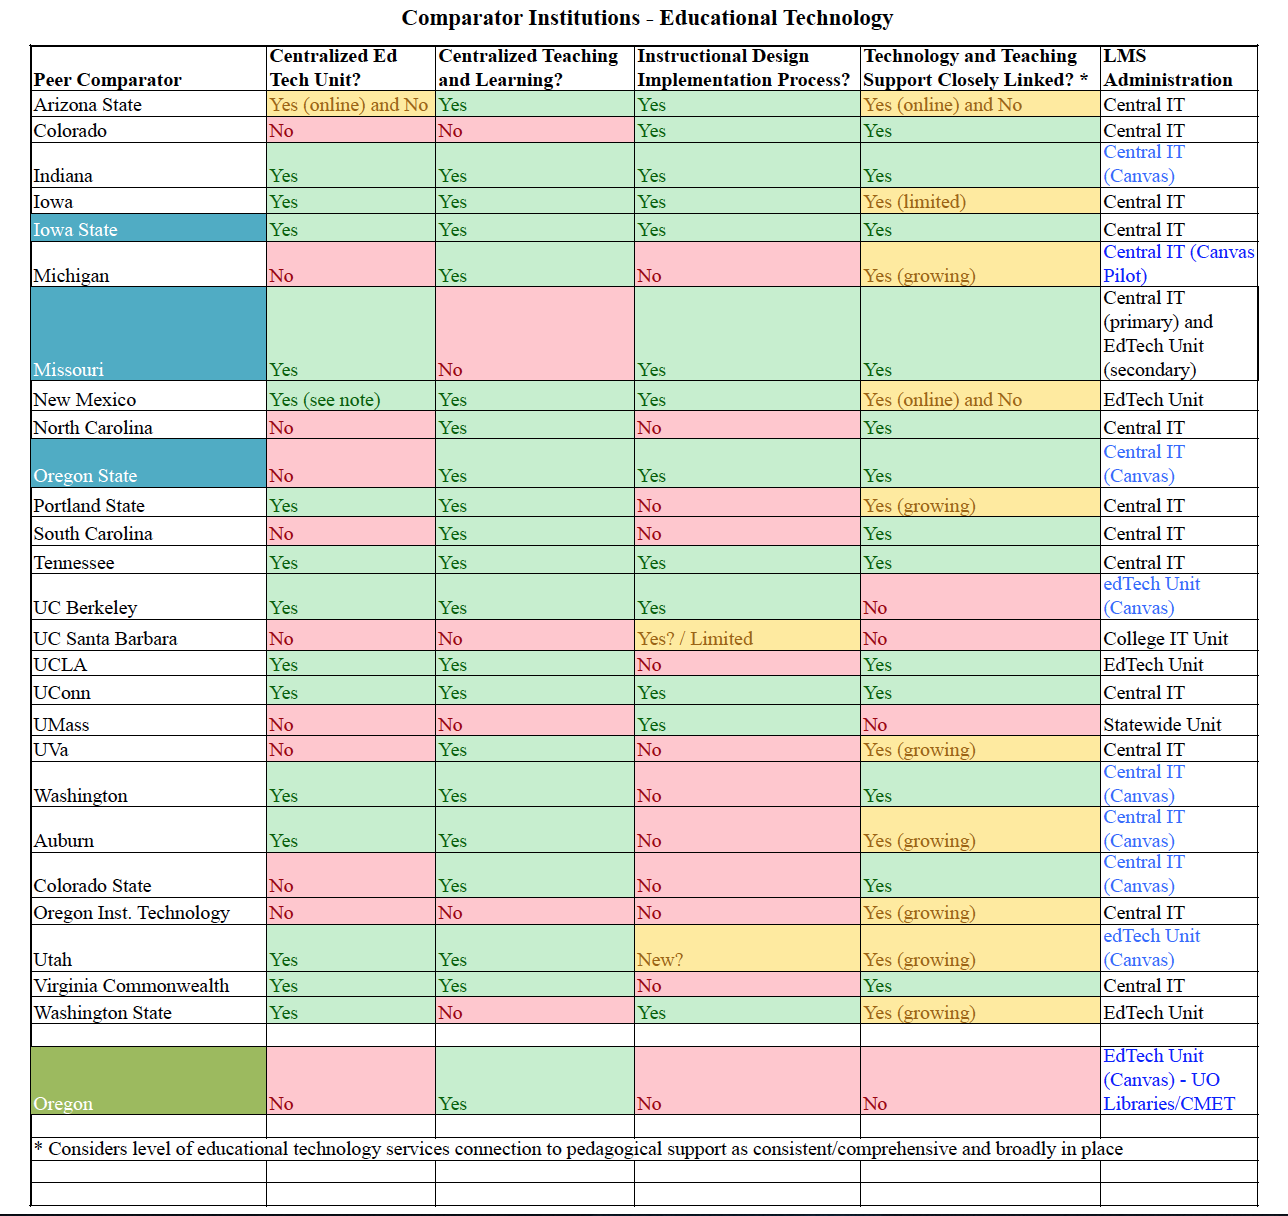
A portion of our initial data set.
Based on the notes reflecting answers to the five questions that guided our first round of research, our spreadsheet data (downloadable below summarizes the organizational structures of Continuing/Distance Education (CE/DE), Teaching and Learning (T&L), and Educational Technology (EdTech) programs for each of the 26 institutions initially surveyed. While not reflecting all significant points of analysis, what seemed most striking was how different institutions structured their activities and coordinated — or not — these activities.
To start we evaluated the CE/DE and online programs, determining whether they were organized as decentralized, centralized (shared), or independent within the following definitions:
- Decentralized: Department-driven, varying sophistication across university, usually modest goals
- Centralized (shared): Shared central service model, supports motivated academic units, but limitations on unified goals
- Independent: Autonomous unit, unified brand, clear (aggressive) goals
We determined whether there was a single, central online unit (and whether the CE/DE unit was that central online unit), whether there was a central educational technology unit, a central teaching and learning unit, and whether these were closely linked (shared programs and emphasis, collaborative activities, etc.). We also tried to identify whether there was any formalized instructional design process to implement technology-enhanced courses.
Because UO has been transitioning from one LMS to another (i.e., from Blackboard to Canvas), we then identified the vendor and the administrative/hosting unit of the learning management system(s) in use at each institution. We then continued with a general assessment of how each institution developed or changed their structures into the current forms (initiatives could be top down (internal or external authority), lateral/collaborative efforts (within and across elements of the institution), or some mix of multiple methods. The majority found change initiatives coming from multiple pathways, perhaps for different aspects of their digital technology environment.
At the end of our first sheet of data, we provided a subjective assessment of each institution’s activity in supporting innovation, with specific notes on whether EdTech learning communities were utilized and whether there was a significant, consistent effort to fund faculty development of technology-enhanced courses. Cells painted blue indicate categories with high-quality or interesting elements that warranted further investigation. Finally, we also noted whether the institution as a whole might serve as a useful point of inquiry for UO overall, and indicated an assessment of how far “ahead” of UO’s current digital education environment each university might be.
The second data sheet focused on the online programming for each institution. All of these peers offered at least some individual online courses, but beyond that we attempted to provide a best count of offerings in the number of full online undergraduate degrees, of online degree completion programs, of graduate degrees, of graduate certificates (here defined as credit-bearing certificate programs, not all institutions define certificate programs in the same way within areas such as undergraduate, graduate, non-credit, and/or professional programs), of MOOCs, and of online non-credit education in general. Where possible numeric counts are provided, within the categories of none (0), Limited (1-4), or Many (5+).
Downloads
- First Round Data Summary: Educational Technology Scope and Services [PDF]
- First Round Data Summary-Extended: Including an assessment of each institution’s support for innovation [PDF]
- External Models Spreadsheet: Initial data from three of the four institutions surveyed in greater depth in the second round of our research. [XLSX]
- Online Programming Summary [PDF]
- Full Data Set [XLSX]
Disclaimer
All material presented here is based on the assessments of InTRO staff, made through the collection of publicly-available data and through a small number of conversations with staff at peer institutions. All statements and opinions here remain those of InTRO staff, formed in order to address needs and questions specific to the University of Oregon.
