

Assignment 6: Integrated Urban Design Development
Please use my Journal of Urbanism article and Salvador Rueda’s BCNecologia_Presentacio Superilles. Please see Barcelona Urban Design Program 2016 Project 1 examples.
INTRODUCTION: Purpose to Problem (thesis), Context, Problem and Purpose
- Title: Two-word title, icon
- Purpose Statement as typed paragraph: What is the problem, how is it applied to Superillas and social interaction? Who is affected (be as specific as possible); Why is it important, including social value? (highlight key words)
- Social Interaction , Ecology or other theoretical underpinning: diagram theory. List urban qualities and indicate if each is a physical urban characteristic or a an urban phenomena.
- Qualitative Conceptual Images: Small thumbnail pictures and/or narrow texture of swatch of qualitative image/material perhaps hinting at final programming / human experience output. Example: seating, play, eating. Graphic hints: set the tone for the unit and highlight color here


BACKGROUND: Contextualization
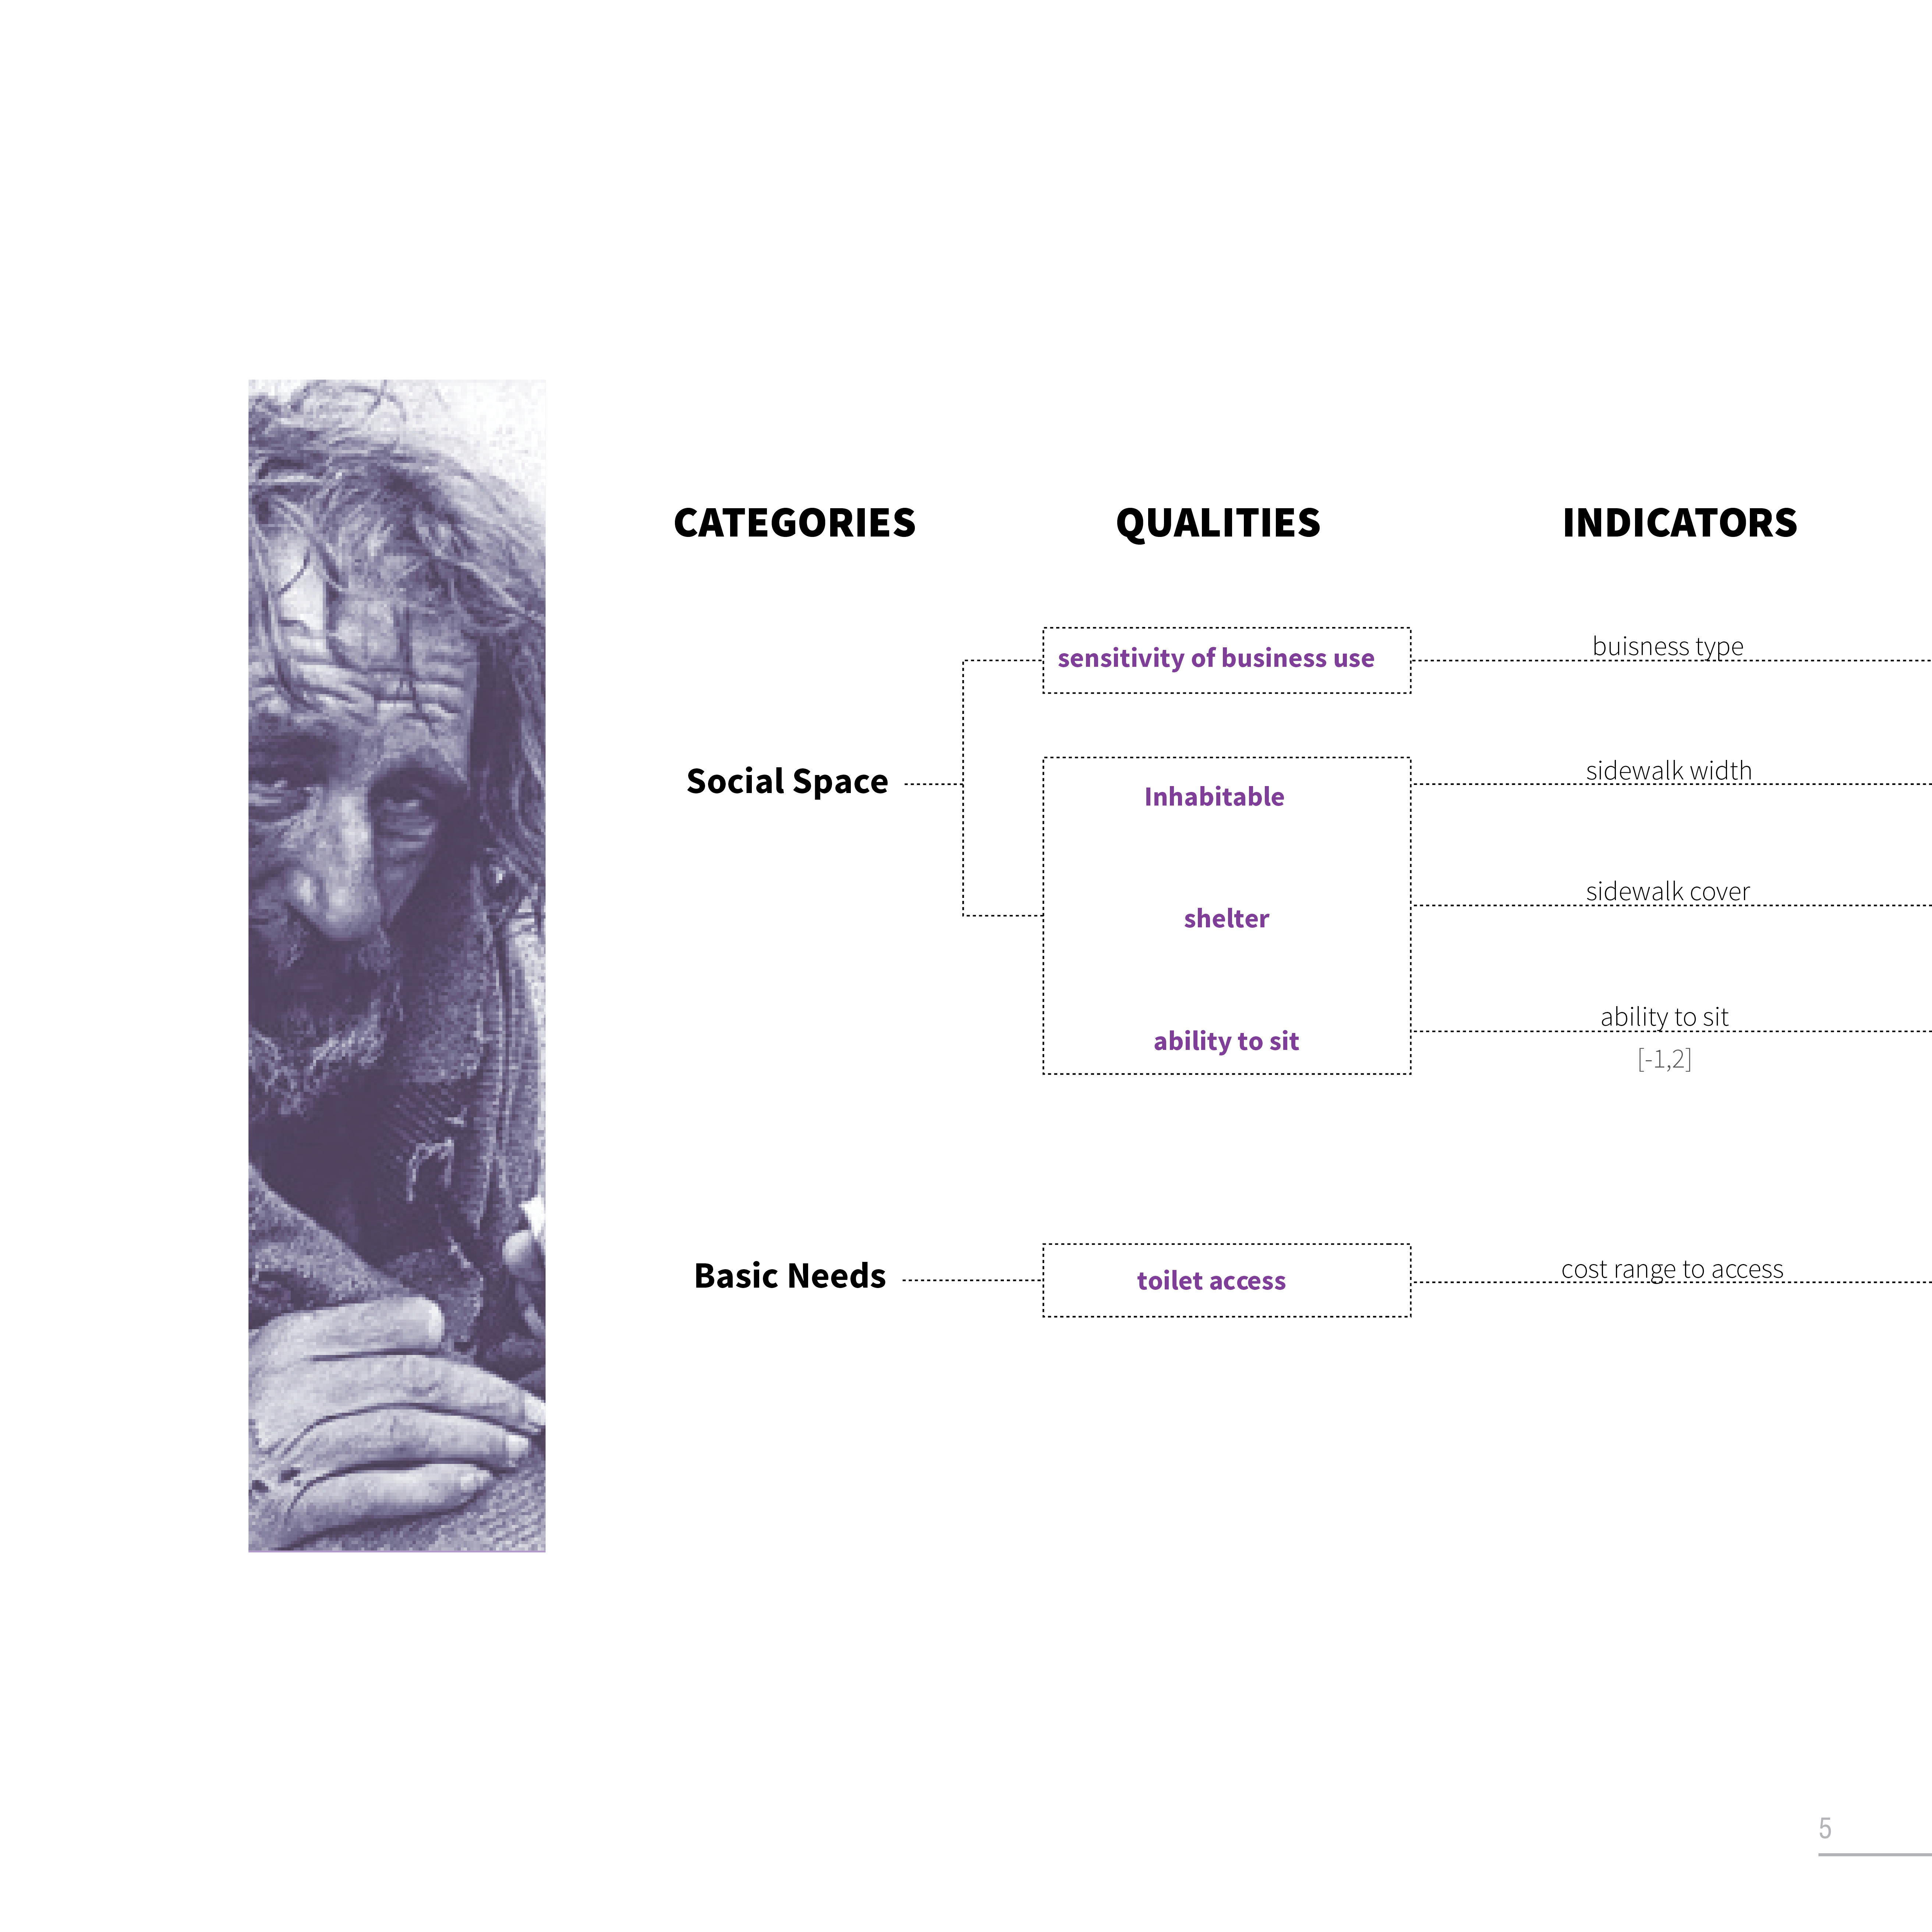
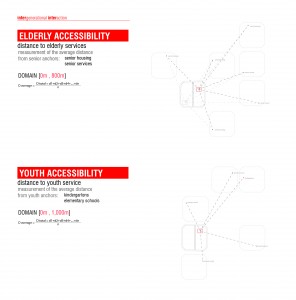
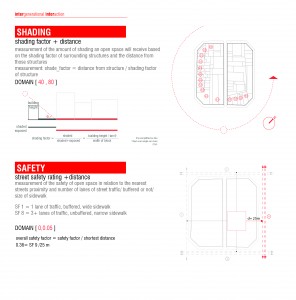
- Outline: Diagram and or Google Sheet of Purpose / Primary and Secondary categories / Qualities / Indicators (history) / On-site or Off-Site / Fixed or Phenomena
- Literature Review: (3) 2 paragraphs of theory / readings, specific then general. Specific Paragraph 1 (hour glass): 1) idea; 2) citation; 3) further idea. General Paragraph 2: 3 sentences explaining how this applies to your project. **Address ideas from the reading that include: downtown urbanism; Latour’s idea of attachment; Corner’s idea of adaptability with specificity; Jacob’s idea of unpredictability; Schartz’s idea of scenarios; Guallart’s idea of self-sufficiency (post); Jan Gehl’s ideas of walkability (post); or other ideas from the readings.
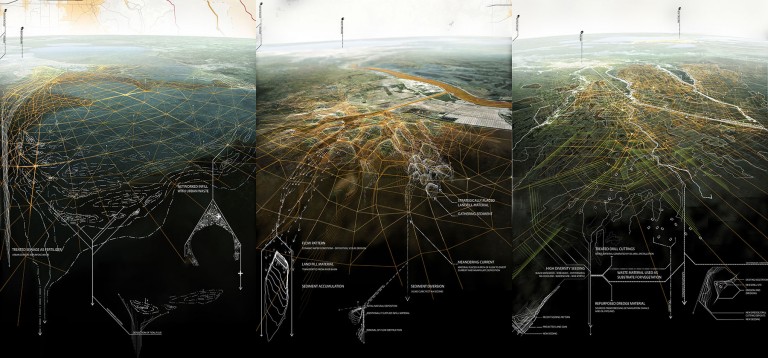
- Research Portland problems: 1- 3 recent articles as quotations or informational statistics (The Oregonian, other) (FYI, City of Portland; State of Oregon, RAIN). Consider Interboro graphics with thought bubbles and stakeholders, 2nd image from top.
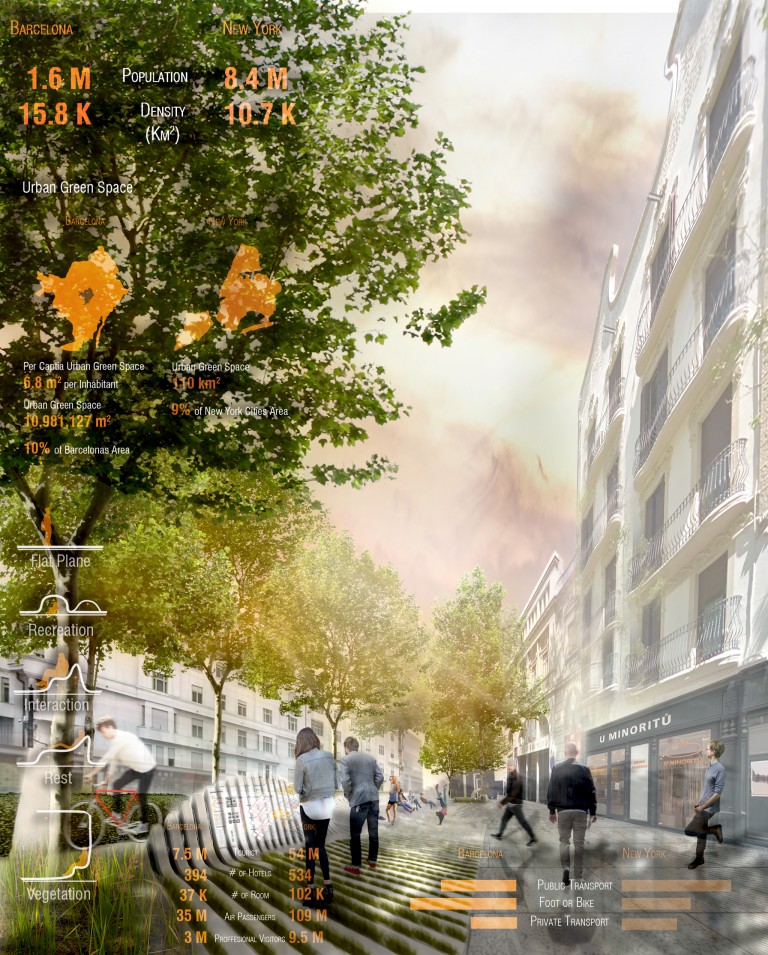
- Comparative Statistics: Infographics to set a quantitative baseline big picture to small picture indicators to follow.
Quantitative and Qualitative Baseline (statistics and info-graphics)
- Qualitative media: picture (zoomed in) of your urban design characteristics (criteria)
- Abstract scientific data: measurement of basic relationships, statistics related to measure quality (ex. 6:1 water to urban farming recommendation). Abstract and Baseline models. Ex. Cost of water Barcelona / Granada. Ex. Overnight temperature difference, humidity, income per capita, etc.
- Policy Context: Oregon/Portland/SE Industrial Sanctuary, BCNecologia_Presentacio Superilles, Patrimonio (Generalitat/Ajuntament) vs comparative city such as New York/Barcelona. Can you find relevant law or ordinances in the USA, Oregon, Portland, Multahoma County or the USA
- Planning Diagrams: visualize/organize relationships of your ideas in degrees of time, material, space and real-time data
- Ecology: Bar charts and graphs may also be helpful, especially for quantitative contextualization and possibly comparison.
- 05C Landscape Catalog: Revise. More line drawings. Smaller or more isolated material swatches.
- GH Plugins: What additional advanced GH plugins would be helpful (show their icon)? Ex. Ladybug, Firefly, Diva. (“Design Technique”)
- Sensors (on-site): What sensors might be helpful? +Find online an example with script and prototype diagram. Reference it. ++Inventory what you will need.
- Real-time Data (off-site): What databases exist?
- Methodology Diagram:
 Figure above, Stephen Maher’s Diagram for Elephant tool and Food Cart / Food Truck Study Portland and New York.Data dimension: accessing urbandata and making it accessible, bottom of page 69.Figure above, MIT SenseABLE Cities lab
METHOD
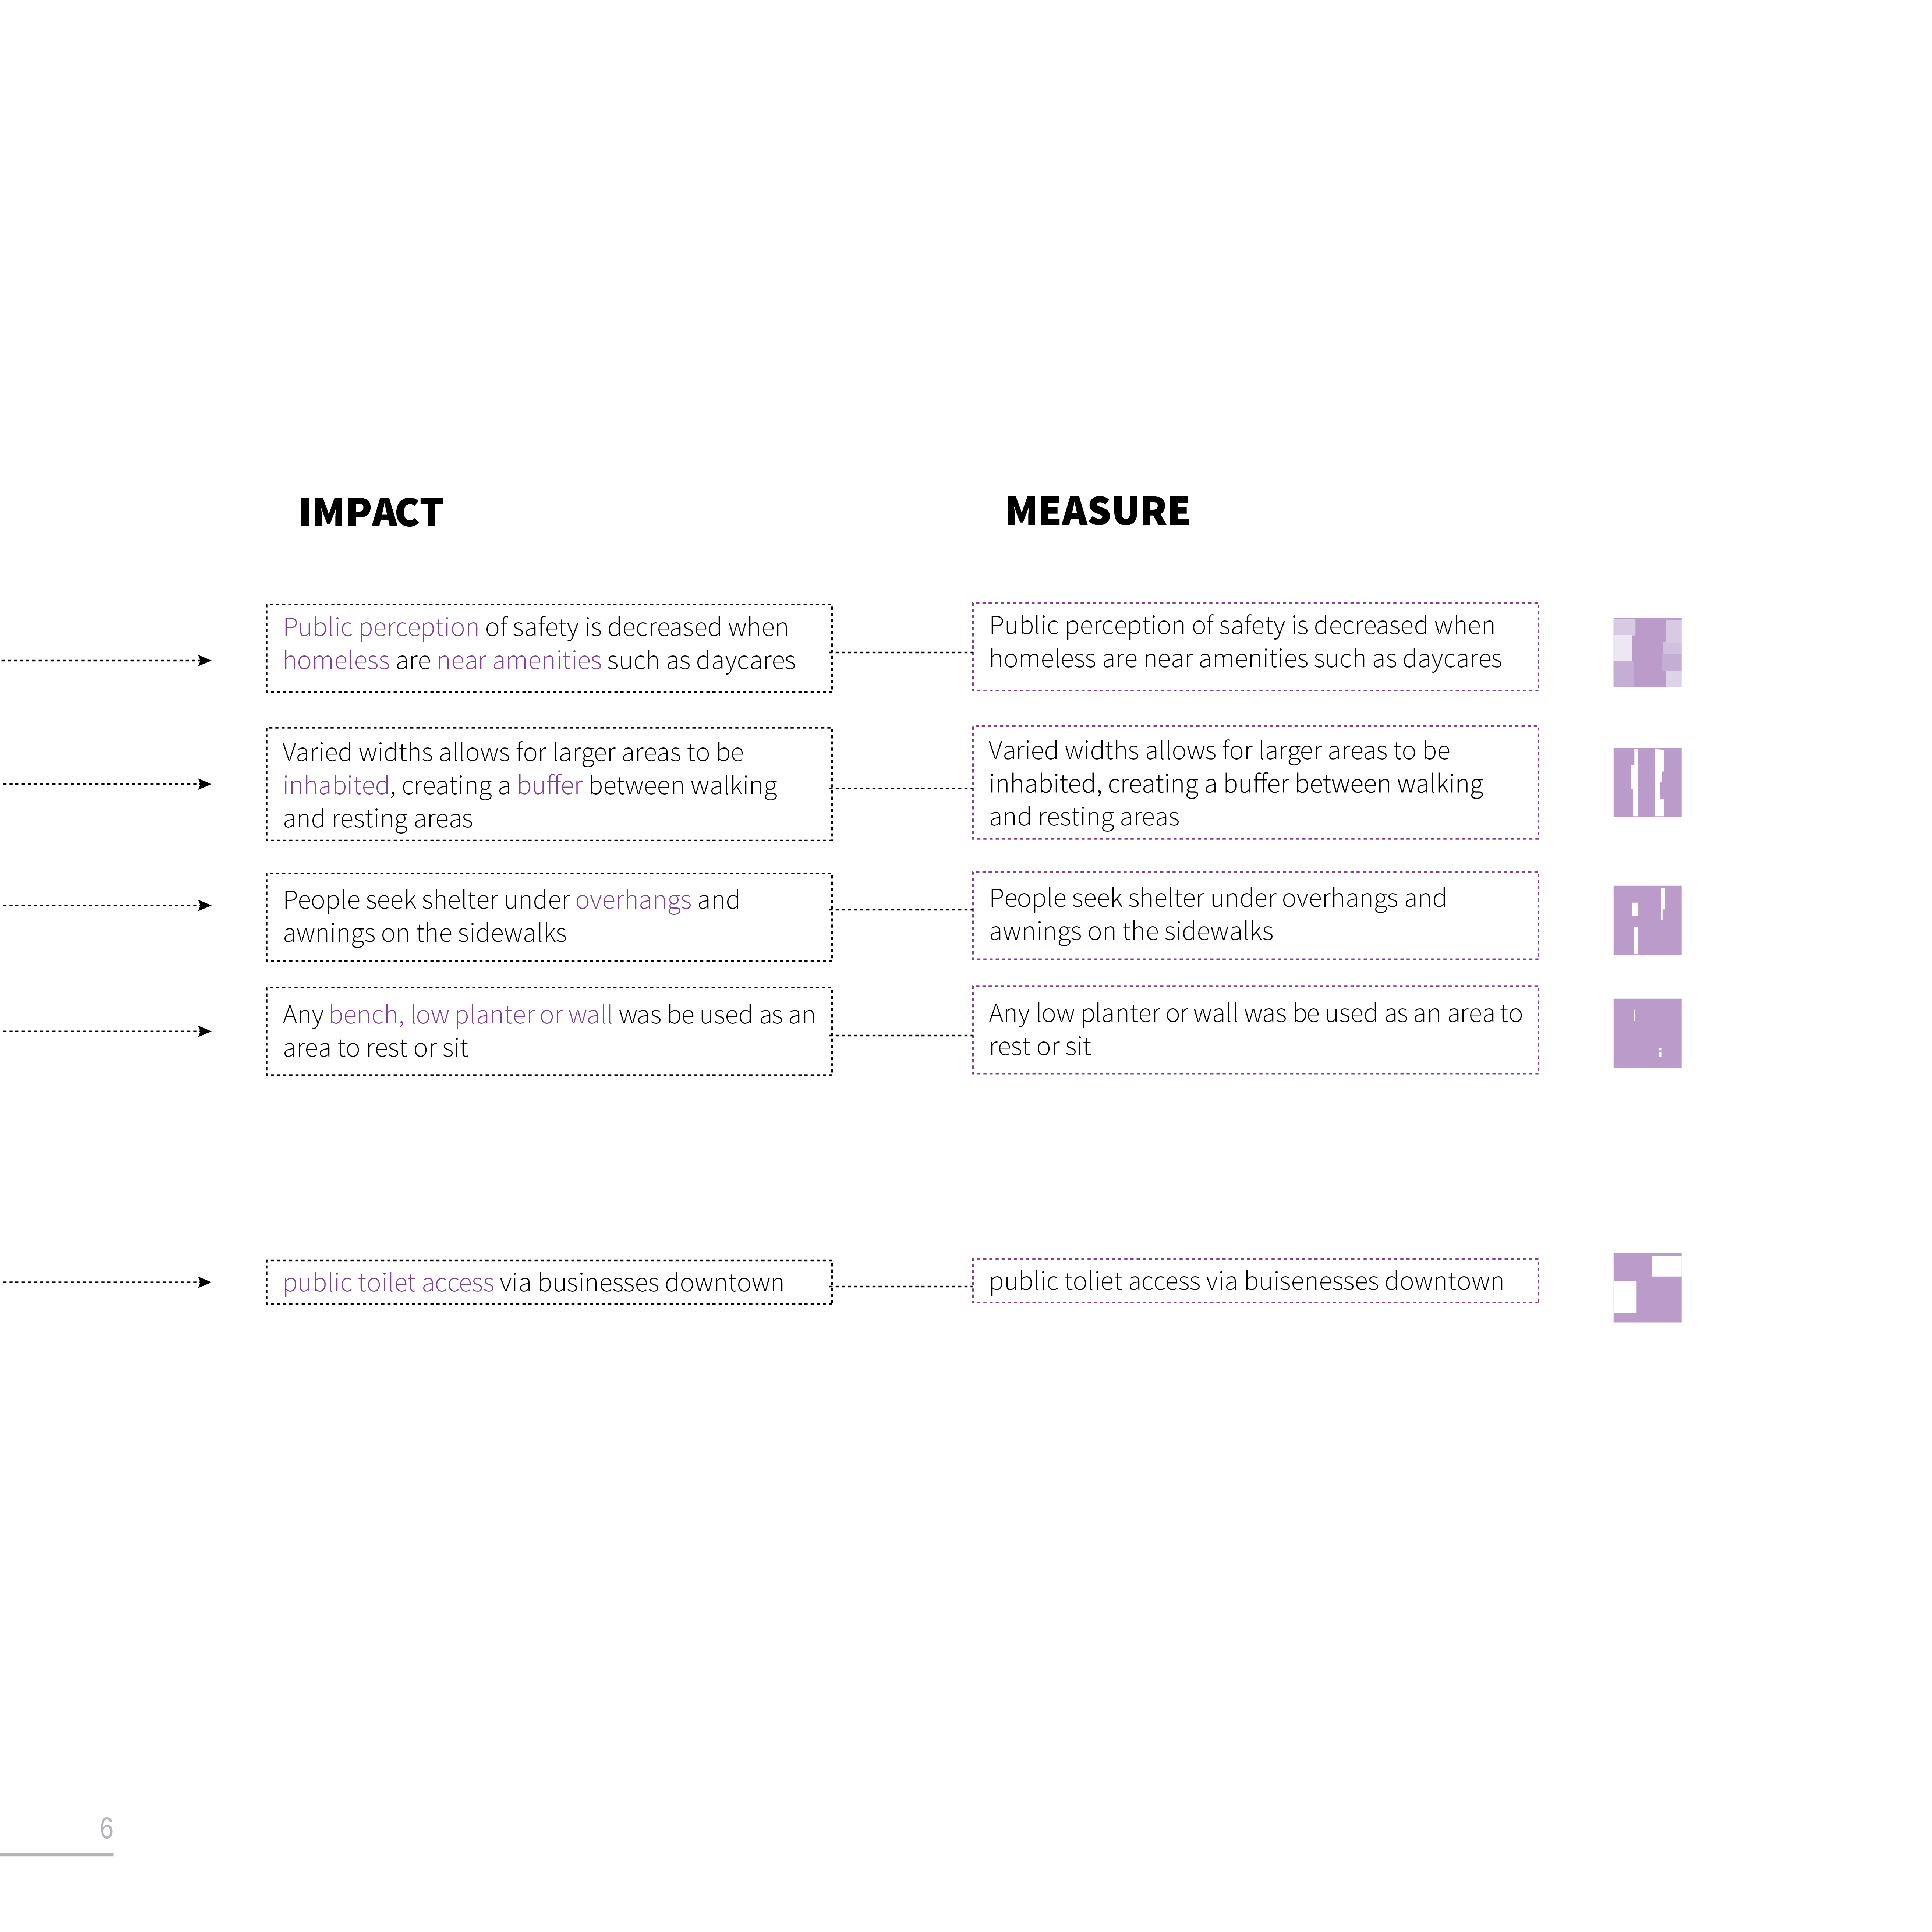
- Workflow Diagram : Categories, Qualities (evolution), Indicators, +Data Dictionary Descriptions, +Numerical Coding, Impact, Measurement, Thumbnail Diagram and or Icon.
.

- Location Plan : locate your study area superilla in Portland (see Guallart drawings)

(*control edges, consider raster background image at special areas in the neighborhood plan such as waterfront, green spaces or other spaces related to your Purpose Statement). Consider highlighting the Barcelona Superilla plan.
- **Unit Module Diagram: Street / Intersection and Point Location at Sidewalk Unit (axonometric or plan) (Example, water catchment, air quality area, zoning use, street-level shop use, street trees, shrubs, running paths, exercise space, etc.)
DATA
Individual Qualities / Indicators Layers and Key: Unit Diagrams and Plan / Aerial / Axonometric
Keys:
Plan of individual Data:
- Parameter 1
- Parameter 2
- Parameter 3
- Parameter 4
- Parameter 5
- Parameter 6
Circle Diagram/s of Selected Superilla and Streets


Baseline Comparison Area
- Data Collection and diagrams for Exemplary Baseline Comparison areas in Portland (Examples: E 23rd and Burnside; SE 12 and Division; other)
- Explain why important. Comparative circle diagrams and highlight differences with images and programming text.
COMPOSITE DRAWING: compose various scales of previous drawings including Superilla, street, point data sidewalk diagram, abstract diagrams, timelines, material swatches.
URBAN DESIGN INTERVENTION
- Street Level Perspective of Human Experience: Initial surreal collage highlighting the urban phenomena
- Design Strategy Description: Findings from Sentence and or bullet points
- Measured Drawings: 2D plan, section, detail (see Jesus Arcos)


include data visualization…composite all drawings!
- Mobile or Situated Information Technology (+OPTIONAL): Identify a dataset (could be live data like 01b Diagramming); include GH GIS mapping analysis image (z-line, circles, color blend) at the unit street / intersection and superilla; timeline; and physical situated technology design as kiosk (slab, post or other), lights in ground, etc.
- Dynamics: What is the timeline of the information update?
- Persona: Identify and describe users

