MaxEnt Species Distribution Modelling
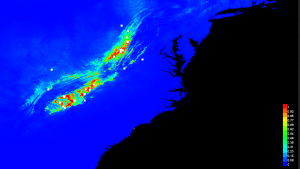
Species distribution models (SDM) may seem somewhat esoteric. These mathematical models take environmental data such as local weather conditions and topographic position and compare them to the point locations of an organism, whether plant or animal. It then uses the combined data set, and applies it to a map, highlighting areas on the map that have the intersection of environmental conditions similar to the species in question. To some GIS users, this may seem like just a simple intersection of GIS layers, which it somewhat is. However, the system can do many more complex interactions and deeper statistical analysis than just the intersection of a couple of environmental variables. For example, intersecting soils and wetlands in a GIS would be a fairly easy task to find wetlands on specific soil types. Now though, imagine adding average rainfall for the area for every month of the year, and the average high and average low temperature for every month of year. The number of variables becomes quite high quickly. An SDM like MaxEnt can process these sets and make spatial predictions, which in turn can be plotted on a map as seen above.
I recently took advantage of the iNaturalist database to download observational data of one of my favorite plants – Southern Blue Monkshood (Aconitum uncinatum). It grows in the highlands of an area where I worked in West Virginia. I used the iNaturalist’s data selection tool to just access and download records of this plant that had been verified by at least two other people. Once downloaded, I then cleaned up the data by removing records where the spatial data were missing or restricted (often because an observation is on private property). I also removed records where the spatial accuracy was greater than kilometer. The end result was a data set of 36 records where this species of monkshood was observed in the Appalachian Mountains.
All I needed now was environmental data. Over the last few years, a group effort by global governments, with the help of researchers, has compiled global data sets of landforms and climate. These sets are available from WorldClim.Org. All You may need is a good internet connection and space on your computer. Some of the sets are gigabytes in size. The data available include the elevation, and average precipitation, and average high and low temperatures for every month of the year for every point on earth, down to a scale of one square kilometer. It’s hard to imagine, but yes, it is true.
Two other tools are still needed. Given that these data sets are huge and that in most cases the habitat in question for a species is with in same region (you don’t expect tigers to live in Antarctica), you can parse the data into much smaller and more manageable chunks. In my case, I wanted to include the northern Appalachian Mountains of the east coast of the United States so I used a GIS program like ArcGIS or QGIS to cut the spatial climate and elevation data into data maps that just included that region. Both ArcGIS and QGIS allow me to export the data files in to the final needed format (.asc) for the mathematical analysis. This is where the final tool comes in. MaxEnt is one of the most popular SDM tools, and can be downloaded free for use. It does require the JAVA computer language and is a bit more difficult to get up and running than many programs.
The end result is that I now have a map indicating where habitat with the similar environmental conditions to where known populations of Southern Blue Monkshood is found. With such a map in hand survey work to find new populations or work on preserving such habitat can go forward.


