Whether you’re working on a big collaborative project or a little personal one, it is helpful to keep track of what needs to be done and when it needs to be done in order to meet your goals. A Gantt chart is a tool designed to help with project management fundamentals like breaking a big project into doable pieces, setting project timelines, and tracking actual progress over time.
I first learned about Gantt charts from a course on Lynda.com. In its simplest form, a Gantt chart is like a spreadsheet: the rows represent pieces of a project like tasks or budget items, and the columns represent units of time.
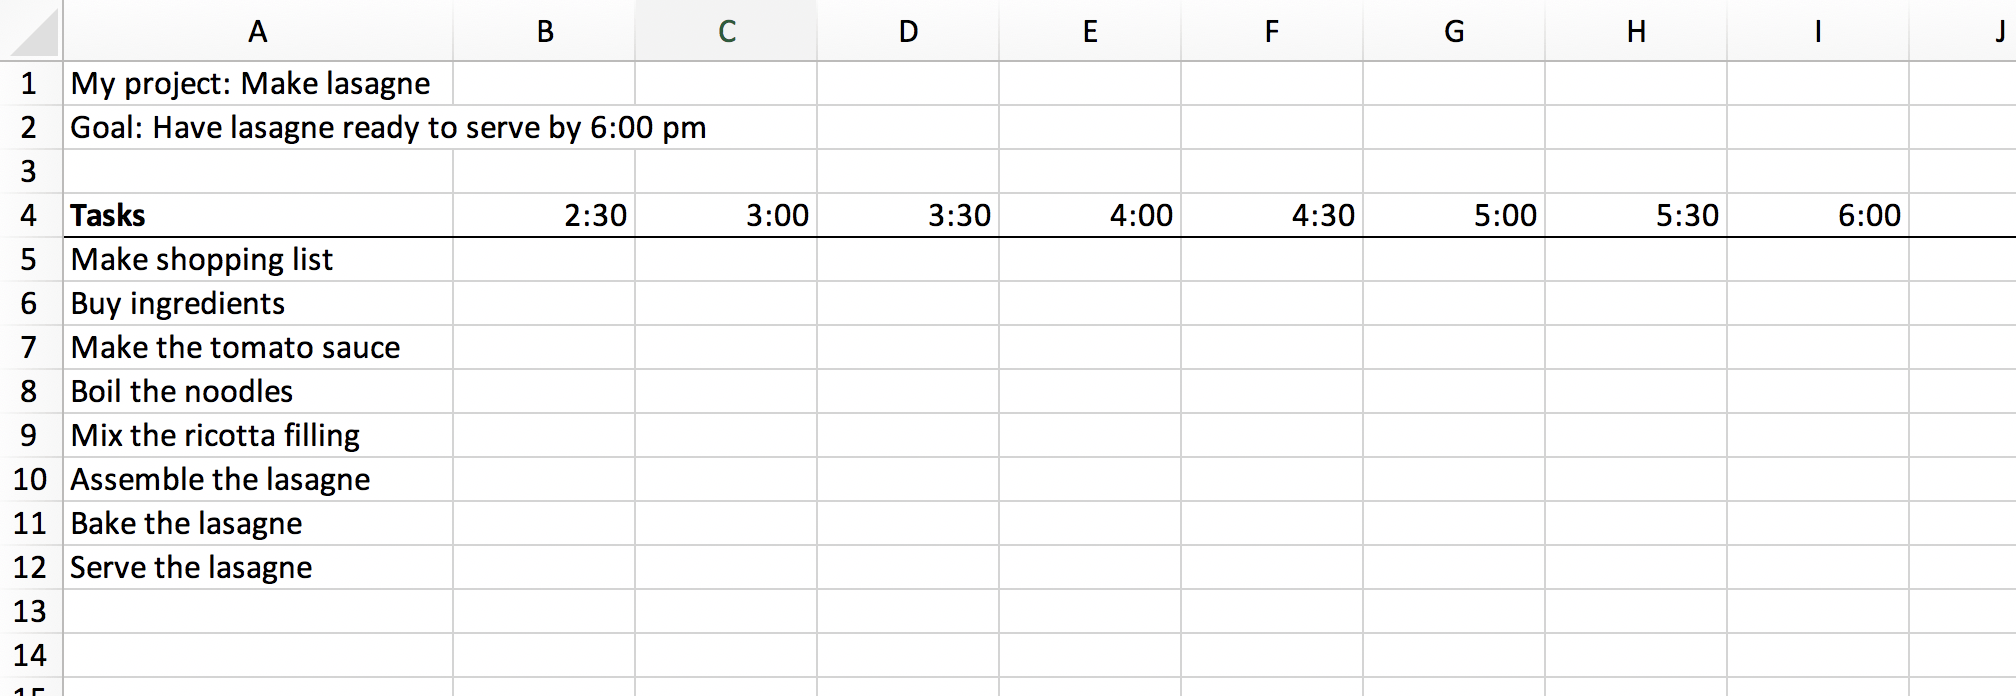
There are plenty of project management programs that can help you make a Gantt chart, but a spreadsheet application (like Excel) will also work just fine. Start by listing all of a project’s “pieces” that you want to track, giving each one its own row in your spreadsheet. Usually these will represent tasks or steps in a process. Then figure out how much time you think each piece should take, and if the tasks have to happen in a certain sequence, rearrange them in that order.

To reach my goal of serving lasagne at 6:00 pm, I will need to complete this series of tasks.
Once you know all the pieces of your project and the order in which they need to get done, decide how to spread them over the time you have. Choose a unit of time that makes sense for your project (days, weeks, or months), and give each time-unit its own column.
I want to serve lasagne at 6:00, and I can start around 2:00, so I divided my time into half-hour intervals.
Now for the fun part! For each task, fill in cells that correspond to the units of time that task will take. If two tasks need to happen in a particular sequence (and can’t be happening at the same time), make sure that the second task’s filled cells begin in the column after the first task ends. As you fill in cells to represent the time that each task should take, it will be easy to see patterns: some times will be very busy with several tasks happening at once, and any sequences of tasks will have a stair-stepped appearance.
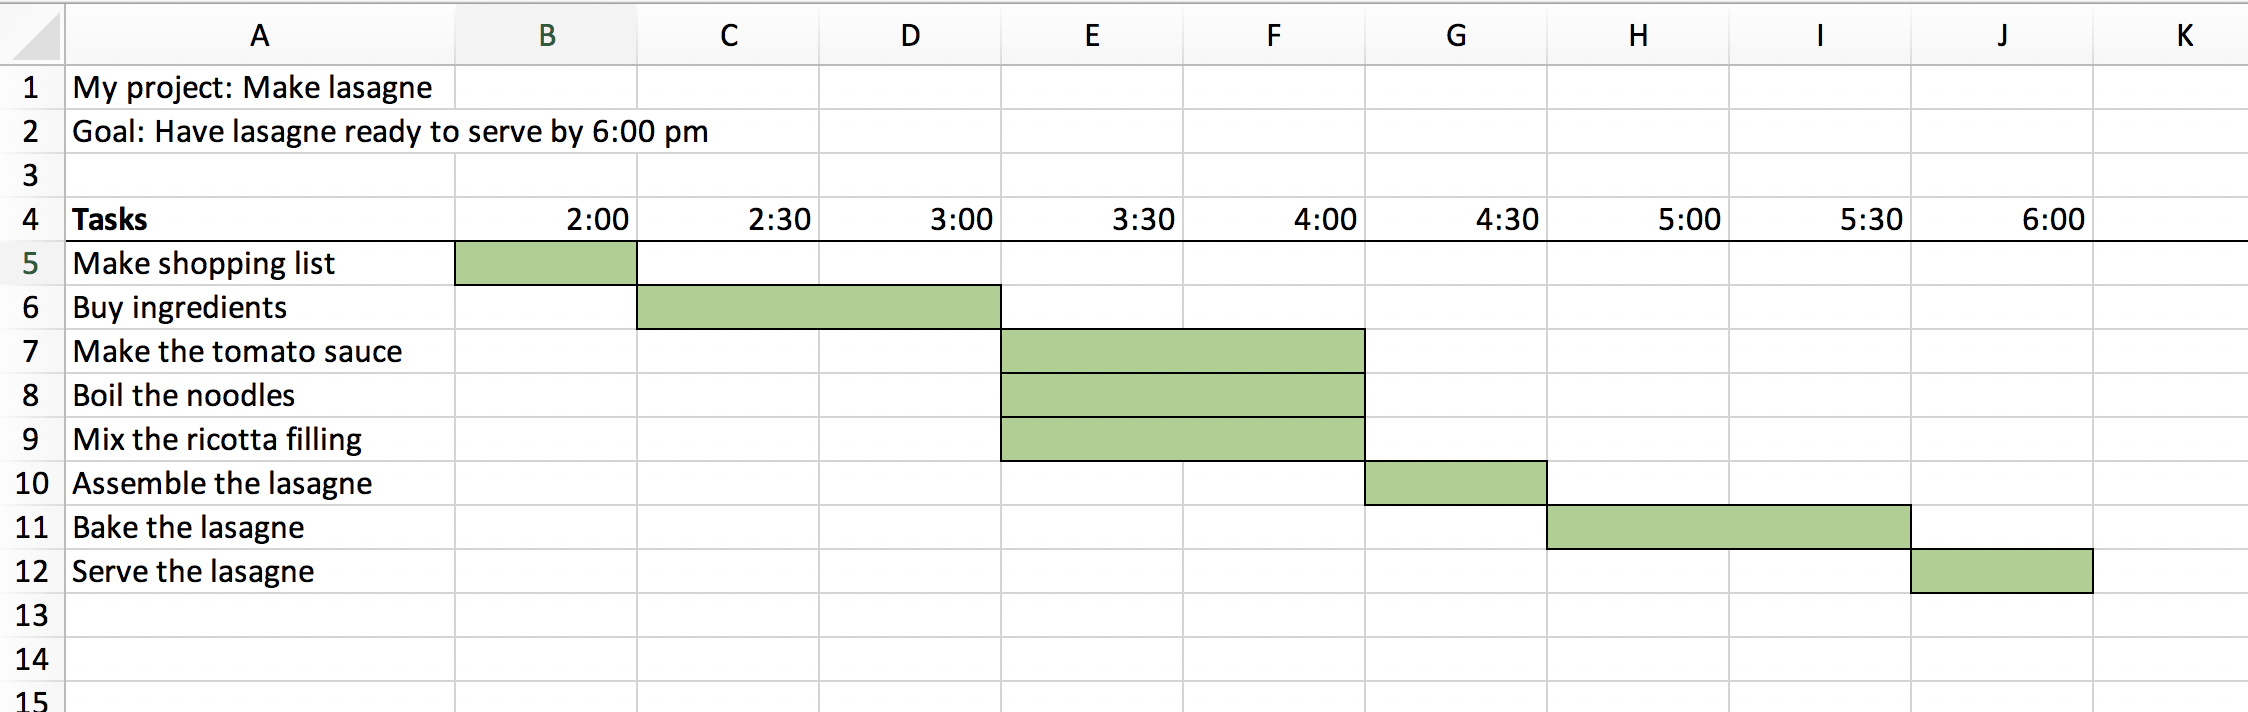
I filled cells in each row to represent when each task should be done.
Once your project is underway, your Gantt chart is useful for tracking progress. Because each column represents one unit of time, you can scan the chart vertically to see what is supposed to be happening at that moment. You can also experiment with how you fill cells; for instance, you might simply outline groups of cells to represent the time a given task will take, then fill the cells with color to represent progress.
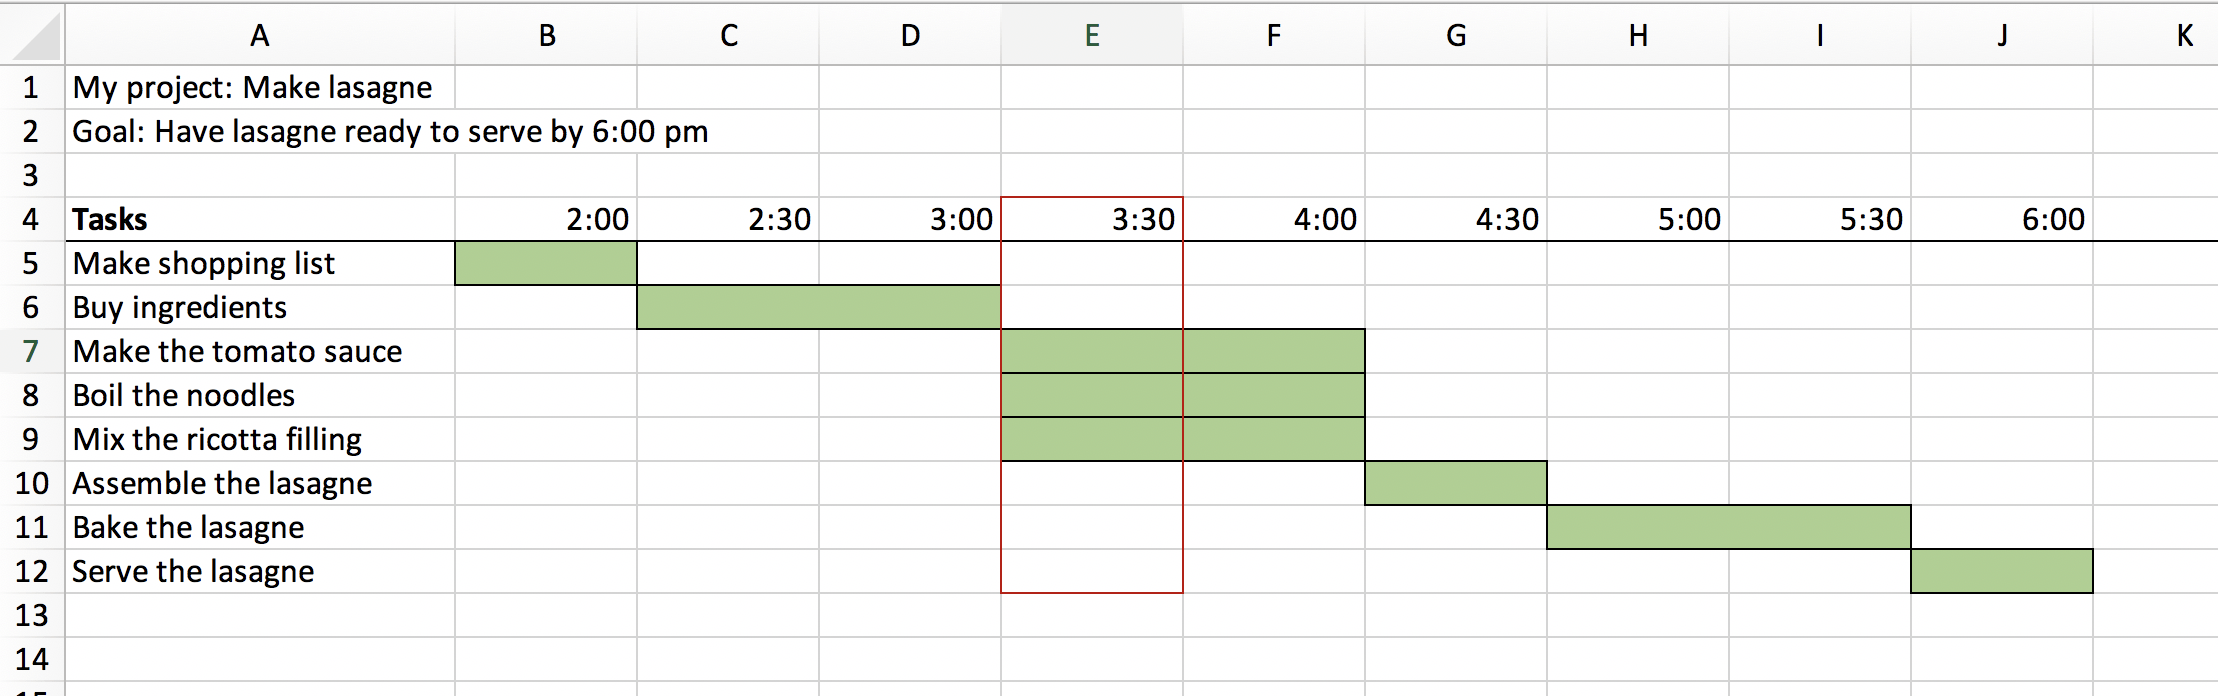
If it’s 3:30, I’d better be preparing the sauce, noodles, and ricotta filling!
Some key terms associated with Gantt charts are dependencies and critical path. Dependencies are strict relationships between tasks; for instance, “Task B cannot begin until Task A is complete.” If the tasks in your project must happen in a particular sequence, then your project has a bunch of dependencies. A project’s critical path is the whole sequence of things that must happen in order for the project to succeed. For example, if your project were to make lasagne, the critical path would probably include items like buying the ingredients, assembling the lasagne, and putting the lasagne in the oven. Items not on the critical path are those that could take extra time or go unfinished without preventing project success. In the case of the lasagne, a task not on the critical path might be to boil the lasagne noodles or add parsley to the ricotta; if you skip these tasks, your lasagne might turn out a little differently than expected, but you could still meet your goal of making lasagne.
I use Gantt charts to help manage the faculty research projects in the Mellon initiative. Each project has its own chart containing all the main tasks to be done and the time they are expected to take. I find it really useful to be able to check a project’s Gantt chart and evaluate at a glance whether we have made the progress we should have by this point in time. Every member of the team has access to the chart so that they can easily check to see if their own tasks and the tasks they depend on are all on track.
Do you use Gantt charts or something similar to manage projects? Feel free to tell me about it in the comments.
Hello there! I just read your blog post on project management with Gantt charts, and I wanted to drop you a comment to express how helpful and informative it was. Gantt charts are widely recognized as a powerful tool for project management, and your post provided a clear and concise overview of their benefits and usage.
I appreciated the way you explained the purpose of Gantt charts and how they visually represent project timelines and tasks. Your step-by-step guide on creating Gantt charts using various software options was particularly useful. It’s great to see that you provided options for both beginner-friendly tools and more advanced software, catering to a wide range of readers.
Additionally, I found your explanation of dependencies and milestones within Gantt charts to be very insightful. Understanding how different tasks are interrelated and how milestones mark important project milestones is crucial for effective project management. Your examples and illustrations helped solidify these concepts in a practical and easy-to-understand manner.
Furthermore, your tips on utilizing Gantt charts for project monitoring and communication were spot-on. The ability to track progress, identify bottlenecks, and share project updates with stakeholders is essential for project success. Your emphasis on the dynamic nature of Gantt charts and the importance of keeping them updated resonated well with me.
Thank you for sharing your expertise on project management with Gantt charts. Your blog post was informative, well-structured, and provided practical insights that can be applied in various project management scenarios. I look forward to exploring more of your content and learning from your expertise in the future. Keep up the great work! Learn more: https://pmoglobalinstitute.org/project-management-office/
Hello there! I just finished reading your article on “Project Management with Gantt Charts,” and I must say, it was an informative and practical guide to utilizing Gantt charts in project management. As someone who has dabbled in project management myself, I found your article to be a valuable resource for both beginners and seasoned professionals alike.
You did an excellent job of explaining the concept of Gantt charts and their significance in project planning and scheduling. Your step-by-step breakdown of how to create and interpret a Gantt chart was clear and easy to follow. I appreciated the inclusion of visual examples and the emphasis on the visual representation of tasks, timelines, and dependencies. It truly showcased how Gantt charts can provide a comprehensive overview of a project’s progress and help in identifying potential bottlenecks or delays.
Furthermore, your article highlighted the advantages of using Gantt charts, such as improved communication, efficient resource allocation, and better time management. The way you discussed the interplay between project tasks, milestones, and critical path analysis demonstrated a deep understanding of project management principles. Your tips on adjusting and updating Gantt charts as the project evolves were also practical and valuable.
Overall, your article served as a comprehensive introduction to Gantt charts and their application in project management. Your expertise and enthusiasm for the subject matter were evident throughout, making it an engaging and educational read. Thank you for sharing your knowledge and providing practical insights into the world of project management with Gantt charts. I look forward to exploring more of your blog posts in the future!
Hey there! 🌟 After reading your blog post on project management with Gantt charts, I couldn’t resist leaving a comment to let you know how much I enjoyed it. Gantt charts have always fascinated me, and your article provided a comprehensive and easy-to-understand guide on using them effectively.
The way you explained the concept of Gantt charts and their history was enlightening. It’s amazing to see how this simple visual tool has evolved over time to become a staple in project management. Your step-by-step instructions and practical tips on creating and interpreting Gantt charts were incredibly helpful. As someone who’s relatively new to project management, I feel more confident in using this tool now, thanks to your clear explanations.
I particularly appreciated the real-life examples you provided, showcasing how Gantt charts can be applied in various projects. Seeing how they help in planning, scheduling, and tracking tasks in different scenarios really drove home the versatility and value of Gantt charts.
Thanks for sharing your expertise and insights on project management with Gantt charts. Your blog post is a valuable resource for both beginners and seasoned professionals in the field. I’m looking forward to incorporating Gantt charts into my own projects and witnessing the positive impact they can make. Keep up the fantastic work! 👍😊
For more information: https://pmoglobalinstitute.org/project-management-office/