Assignment #5 for Monday Part I “Mid-term”
[category: 05 Part I Ideas]
Notes on Monday mid-term presentation:
- Focus on the big idea – sensory experience from qualitative interest to mapping – its less about data and more about systematically organizing your observations of the sensory experiences in the site context AND what is deficient! Incorporate campus planning info from Aaron and programming from Juan-Carlos as much as possible…conceptual links between programming as experience and your interested sensory experiences.
- Leafcutter is the Grasshopper plugin I mentioned for Google Sheets and Docs if you want a more seamless workflow instead of CSVs. Keep investing in the tool because you will continue to use it after this review Monday.
- Yesterdays class is uploading now.
- Dont forget Kevin Nute’s ideas on Animated Nature – maybe use this to test and video record similar affects – anything would be great for Monday. Sound!!
- Meshspray is uploaded to Canvas and a dropped into a new GIS VIZ TOOL_VERSION 13_SOJC but you will have to make adjustments to your data. (NOTE the Rhino file GS VIZ TOOL 4 has a new boundary rectangle added but it is hidden
- Videos (5 minutes): Precedents (LOCAL CODE – VIDEO AND AUDIO OVERLAY, GSAPP PRESENTATION METHODS) we used for Granularity of Time final projects. Consider some video interruptions / pauses of zoomed-in conceptual images of the sensory experience – set the color to match the diagram coding for the presentation to lock the viewer into the color/indicator data match early!! Premiere:
- If anyone would like to borrow my 9 arduino sensor kits please let me know (temp, humidity, sound, light, pressure). 1) they are my personal property, not school property. 2) you would probably put a few out for 15-20 minutes and watch them with your partner. 3) it records data to a chip and has batteries. it outputs to CSV. you shouldnt need to know too much Arduino but a little bit to upload and download data.
- I have a drone (that is UO property) but its a very difficulty and buearacratic process to use on UO campus including pilot license. maybe someone at campus planning can pilot it. would be cool footage).
- You will need to host your video on Youtube or Vimeo – dont do it on WordPress / UO Blogs. Then copy URL or embed code and paste into wordpress post at the top and then all other content below the video. Steven Holl at Kennedy Center Design!!! Site watercolor welcome of forces – not proposed physical massing. (He’s from Brainbridge Island in Seattle – PNW!)
1. TITLE
- Title: two words
- Authors
- Icon/Image of Feeling / Challenge
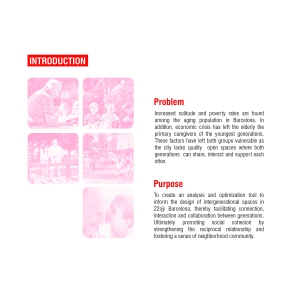
2. INTRODUCTION / PURPOSE: IDENTIFY PROBLEMS AND CHALLENGES TO URBAN HEALTH IN BARCELONA
- Title: Two-word title
- Purpose Sentences as typed paragraph: What is the problem/challenge of urban health in UO Campus + SOJC (prior in Barcelona), how is it applied to Superillas and social interaction? Who is affected (be as specific as possible); Why is it important, including social value? (highlight key words) Consider social issues and ecological issues (air, water, light, heat, animals and green light). (BCNecologia_Presentacio Superilles)
- Use the Social Interaction figure to choose two to three areas. List qualities and indicate with a symbol if it is a fixed urban quality or an urban phenomena.
- Small thumbnail pictures and/or narrow texture of swatch of qualitative image/material perhaps hinting at final output. Graphic hints: set the tone for the unit and highlight color here.
3. BACKGROUND: Context
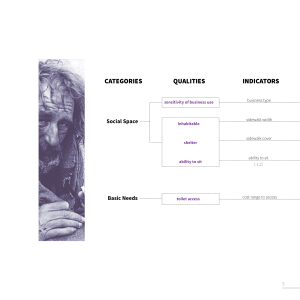
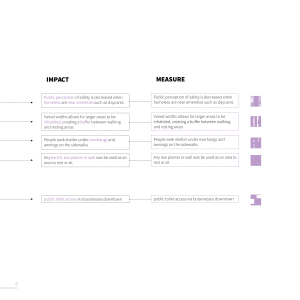
- Outline: Diagram and or Google Sheet of Purpose / Categories / Qualities / Indicators (history) / On-site or Off-Site / Fixed or Phenomena
- Literature Review: (3) quotations of theory / readings we’ve done (blog posts). **Address ideas from the reading that include: downtown urbanism; Latour’s idea of attachment; Guallart’s idea of self-sufficiency (post); Jan Gehl’s ideas of walkability (post); or other ideas from the readings. Remote Work.
- Research site and current UO Campus health and livability problems/challenges: 1- 3 recent articles as quotations or informational statistics (Around O, UO Matters, City of Eugene website) UO campus, city, State Oregon.
- Comparative Statistics (Wiki for Eugene): Infographics to set a quantitative baseline big picture to small picture indicators to follow. Research climate information by month or season such as precipitation, temperature highs and lows, relative humidity, wind direction and speed, animal migration. Research effects of human behavior such as sources of sound pollution (discos, tourists, terraces, schools), air pollution (terraces, construction, restaurant hours), light pollution (cars, commerces). **REVISE THESE TO BE SPECIFIC TO YOUR SENSORY EXPERIENCE QUALITIES / INDICATOR DATA.
4. BACKGROUND: Quantitative and Qualitative Baseline (statistics and info-graphics)
-
- Qualitative media: picture (zoomed in) of your urban design characteristics (criteria)
- Abstract scientific data: measurement of basic relationships, statistics related to measure quality (ex. 6:1 water to urban farming recommendation). Abstract and Baseline models. Ex. Cost of water Barcelona / Granada. Ex. Overnight temperature difference, humidity, income per capita, etc.
- Policy Context: UO Campus Plan + Eugene, Oregon, USA. (prior in
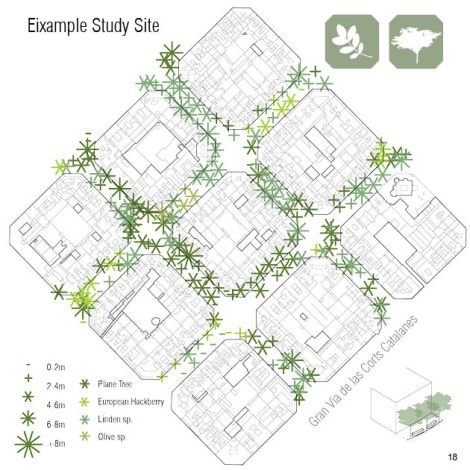
- Ecology: Bar charts and graphs may also be helpful, especially for quantitative contextualization.
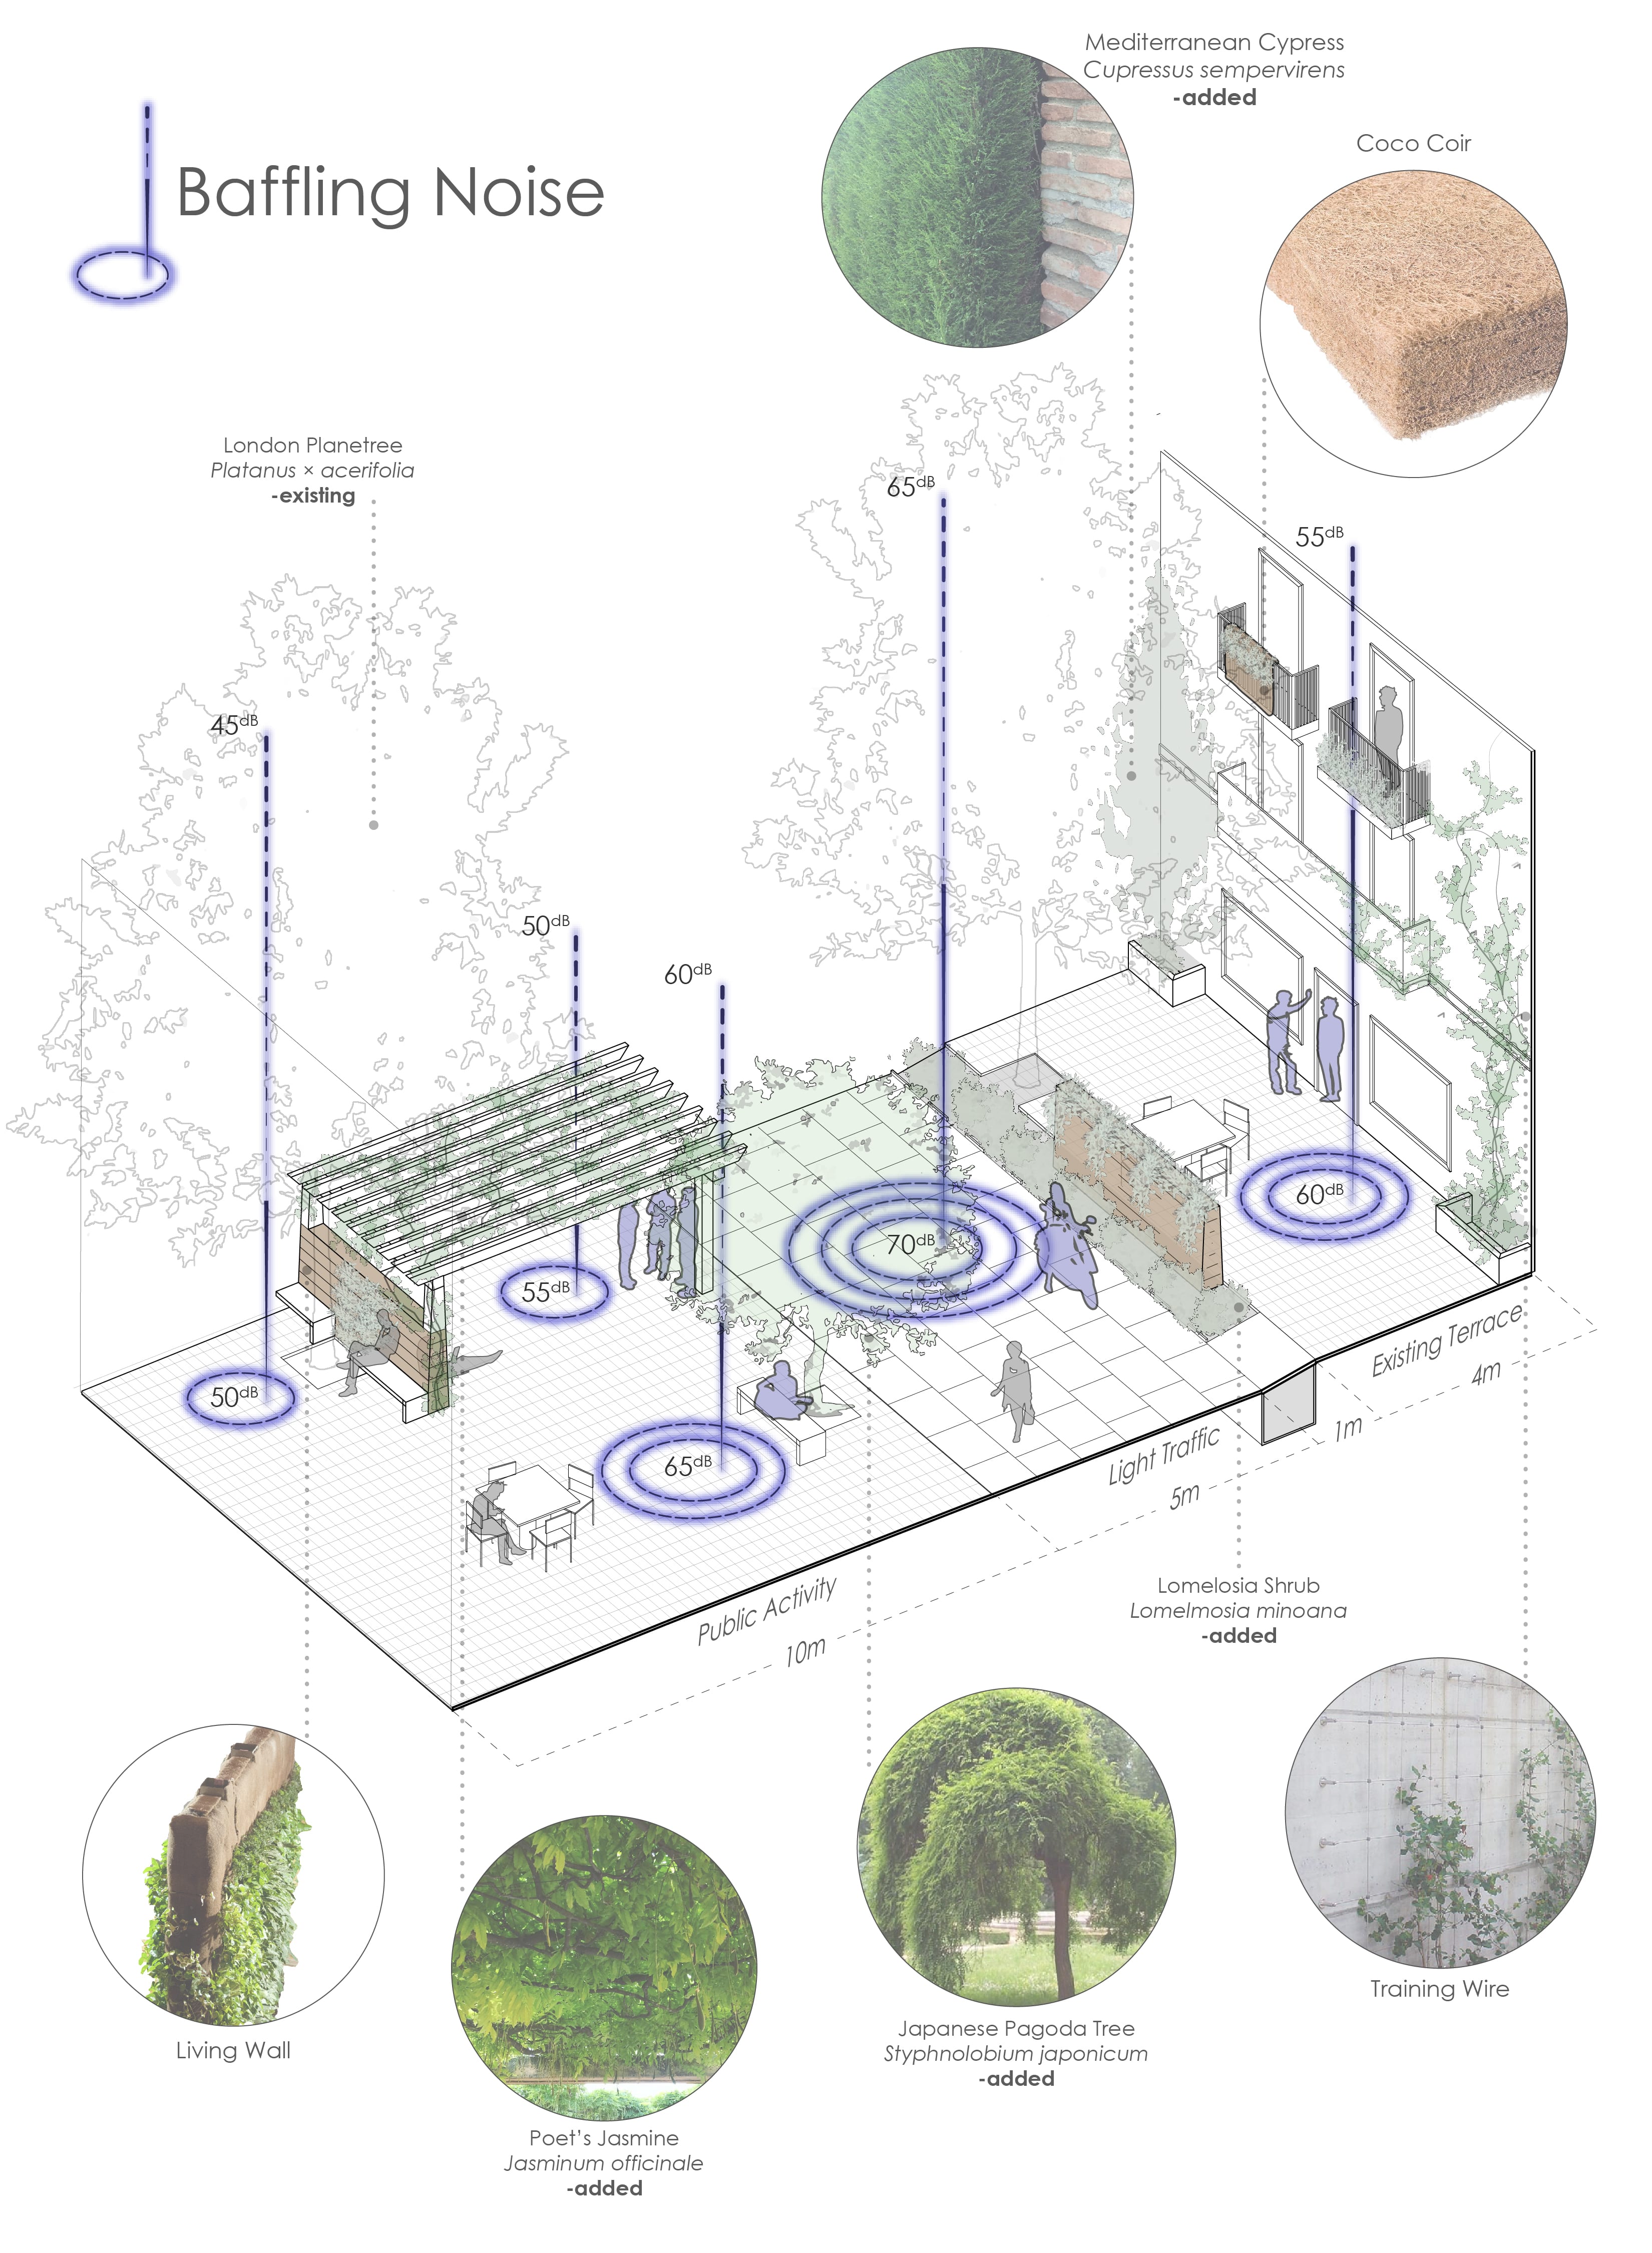
- Sensors (on-site): What sensors might be helpful? +Find online an example with script and prototype diagram. Phone: light, sound, slope (clinometer)
- Real-time Data (off-site): What databases exist?
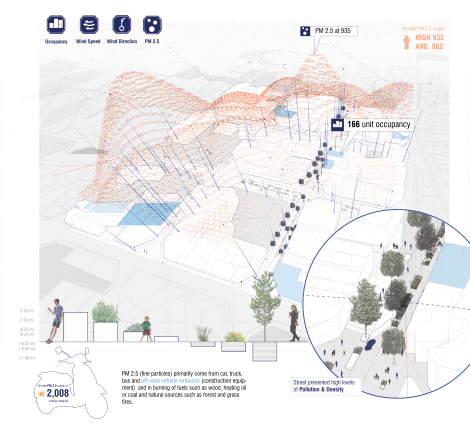
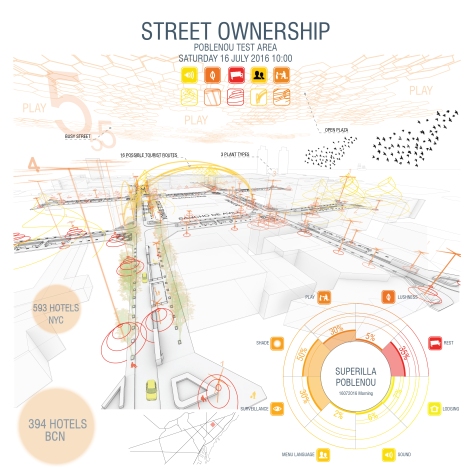
 Figure above, Stephen Maher’s Diagram for Elephant tool and Food Cart / Food Truck Study Portland and New York.Data dimension: accessing urbandata and making it accessible,
5. METHOD
- Workflow Diagram : Categories, Qualities (history), Indicators, +Data Dictionary Descriptions, +Numerical Coding, Impact, Measurement, Thumbnail Diagram and or Icon.
– Plan for each quality/indicator with icon, photographic swatch of each quality, rating system and highlighted axon of each quality.
- Use the GIS VIZ tool to create 2D plans of each quality/indicator. Plan, name, icon, scale/data dictionary
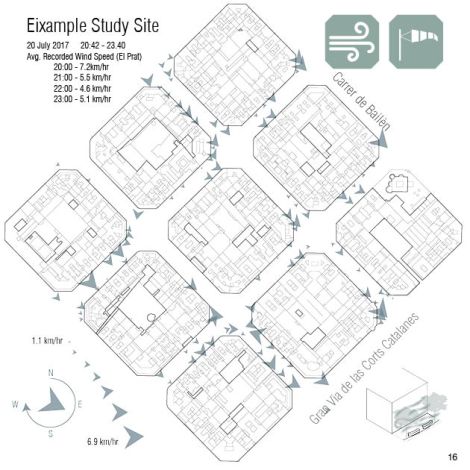
- blog category [04 Project Maps]
– Composite aerial (data + design): perspective view of Campus / site plan , showing +/- 3 qualities/indicators, more detail at foreground +analysis call-outs (as well as other work)
– Eye-level perspective of a campus building in the site area highlighting your qualities. Additional entry / lobby (ground level- human-scaled experience)
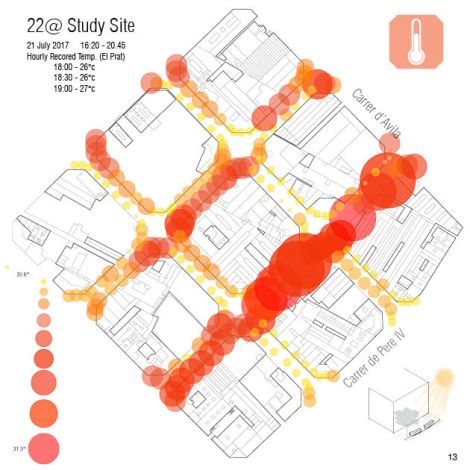
- Climate data (rain, temperature, humidity) of UO Campus(Koppen – Csb = Warm-summer Mediterranean climate; coldest month averaging above 0 °C (32 °F) (or −3 °C (27 °F)), all months with average temperatures below 22 °C (71.6 °F), and at least four months averaging above 10 °C (50 °F). At least three times as much precipitation in the wettest month of winter as in the driest month of summer, and driest month of summer receives less than 30 mm (1.2 in).
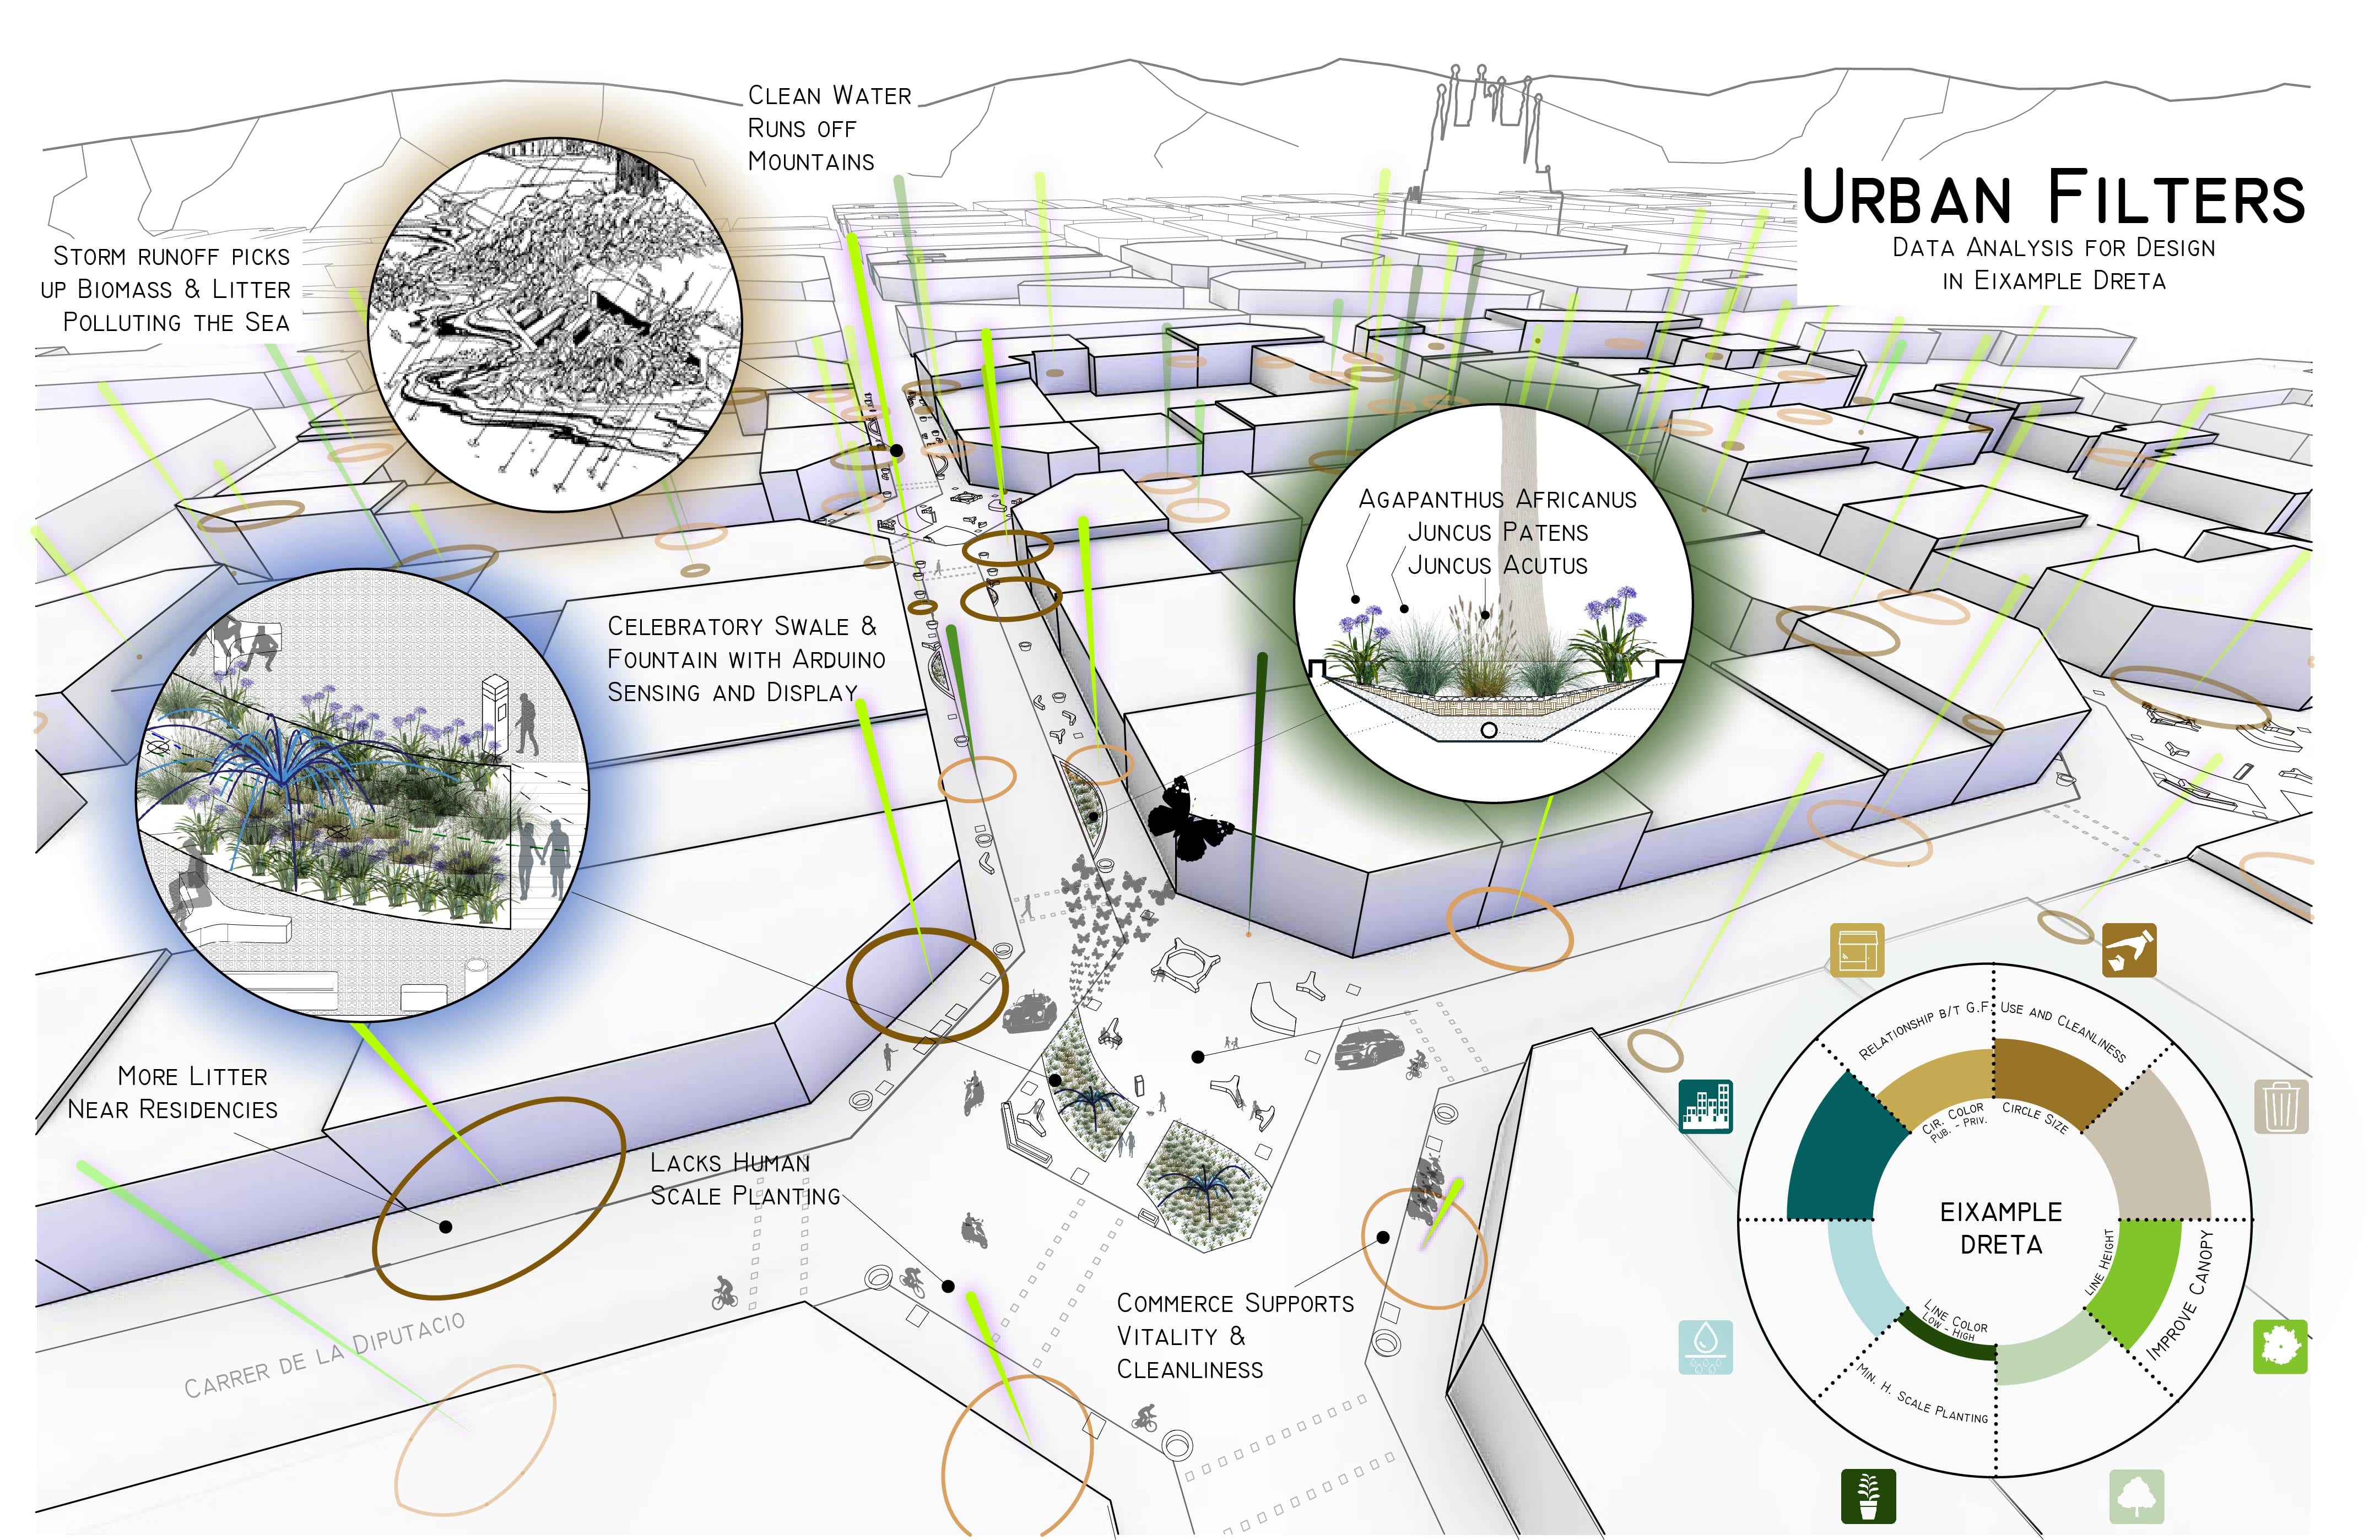
…leading to…


