![The 30 Best Data Visualizations of 2024 [Examples]](https://visme.co/blog/wp-content/uploads/2021/08/Data-Visualization-thumbnail.jpg)
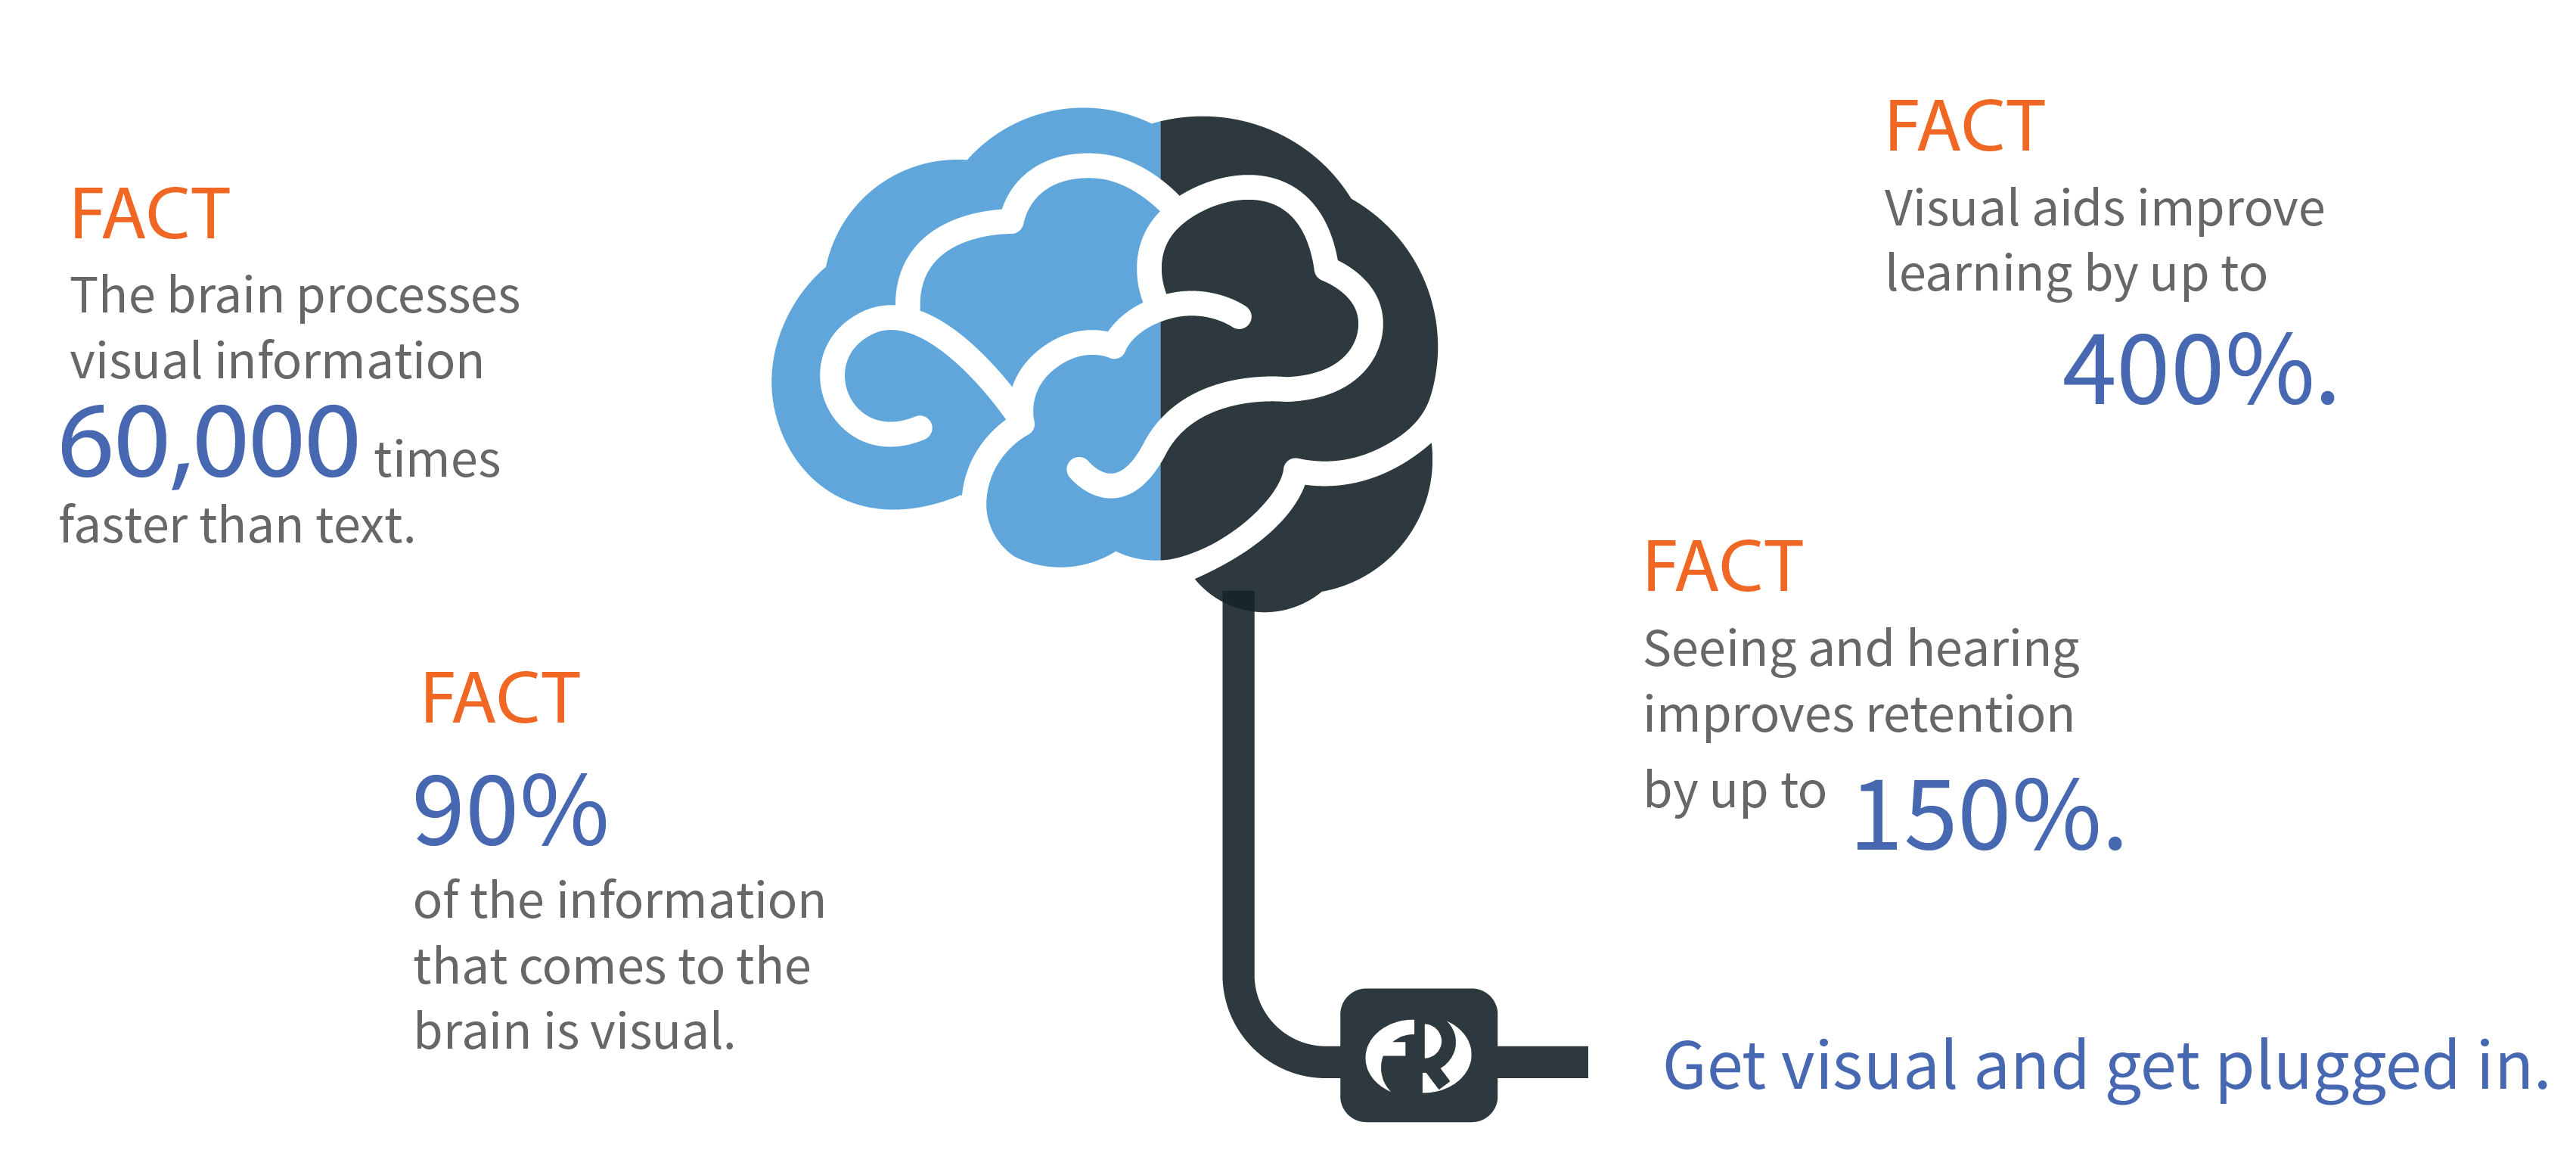
Humans are inherently visual people. This is why we have maps, graphs, tables, and so on to share information. Visualizations are used in almost every aspect of life to help us break down data so that we can better understand complex information. When it comes to history, visualizations of time help us make sense of the past while supplementing contextual information to paint a bigger, broader picture. Visualizations of time tell a story that can be easier to comprehend, conceptualize, and understand. Whether it’s a map time-lapse similar to the slave voyage visualization shown in class, or just a simple graph, visualizations help us see through the data. It can also help people such as me, more easily digest and retain important historical information.
Why Use Visualizations?
In regards to history, it’s often difficult to remember what event happened at what time. I personally struggle with retaining specific dates and many of the key events. This causes everything to kind of just bleed into one another. As a visual learner, having visualizations of time helps me immensely in not only retention but with comprehension as well.
Time Within the Testimonies
Within the testimonies I transcribed, time was not mentioned very often. They would bring up a certain month or season, but nothing specific. It’s unfortunate that dates were not discussed, because it’s such a fundamental part of helping people piece together a broader picture of the events such as the Morant Bay Rebellion. 
Visualizations Create an Impact
Visualizations have the ability to emphasize information in a way that cannot be done through writing. We can read all about shocking and horrific statistics, but humans are already so desensitized that for many people, it doesn’t really impact them. When we have visualizations, we can actually put numbers into perspective. I believe that humans react with more emotion and intrigue when we actually look at visuals rather than read information from densely written articles or documents.