Posted on behalf of Greg Bothun (Physics)
Measuring impact of one’s peer reviewed publications is generally a highly subjective process and often it is assumed that if one publishes in the leading journals of their field, then those papers automatically have high impact.
Here I suggest a modest data driven process to remove this subjectivity and replace it with simple objective procedure that can be easily applied to Google scholars since the data is readily available.
This procedure basically involves using the time history of citations as an impact guide. The concept of ½ life is relevant here where after some paper is published there is some time scale over which ½ of its citations have occurred. Papers with longer ½ life, likely have had a larger impact. By way of example, we offer the following kinds of profiles:
- A high impact paper is one that has sustained referencing over time, at a quasi-constant level: Two example time histories of such papers are shown below (note that the form of the graph is more important than the actual citation numbers).
Paper I: Published in 2005 which does not show decaying reference behavior but fairly sustained referencing over 12 years:

Paper II: Published in 1986 which shows quasi-constant referencing over a 30 year period (yes it sucks to be old):


- Next example is a more rare form, which we will refer to as Pioneer impact. In this case the paper is not well acknowledged near the time of publication but has been rediscovered in later years.

In terms of numbers, the period 2000 through 2011 contains ½ of the total citation number (244), while the other ½ occurred over the 6 year period 2012-2017. This is a qualitatively different citation history than the previous example.
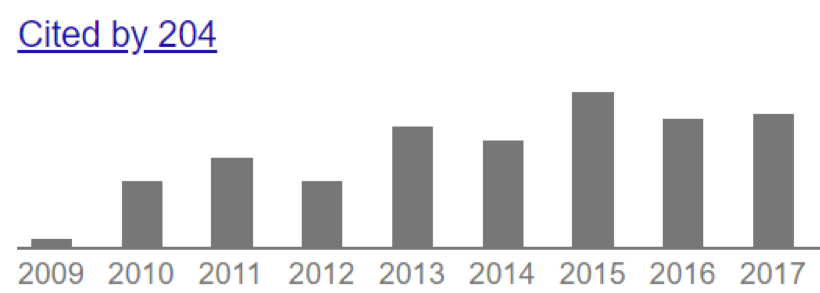
Another example, this time on a small citation lifetime timescale, is shown below:

And here is an example of almost no impact early one, but the techniques described in the paper were discovered or emerged 10 years later:

- Finally there is the case of the average or Moderate Impact which has a decaying citation curve and a relatively short ½ life. Examples below:


For the latter case, although there is a long citation tail of low annual citations, ½ the citations were earned in a 5 year period near the time of publication.
- Finally there is the case of the Low Impact paper (like most of fine) – that has just a brief citation annual rate before decaying:

I am not advocating that any of the above procedure be used, I simply saying that information in addition a raw number is available and can be used in some way to better characterize impact.