Visualization Methods, urban ecology – Composite Drawings
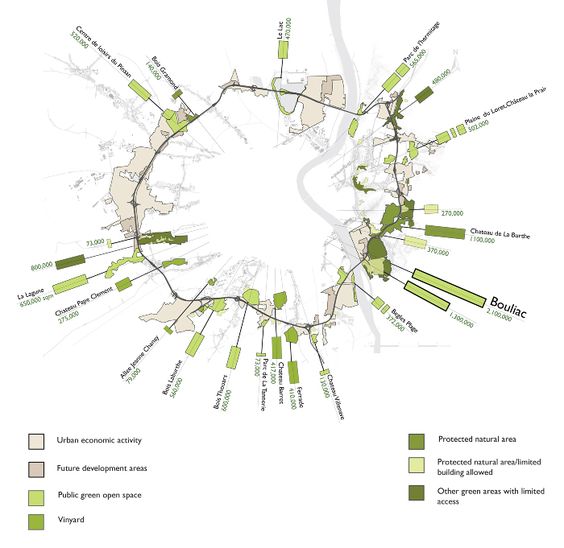
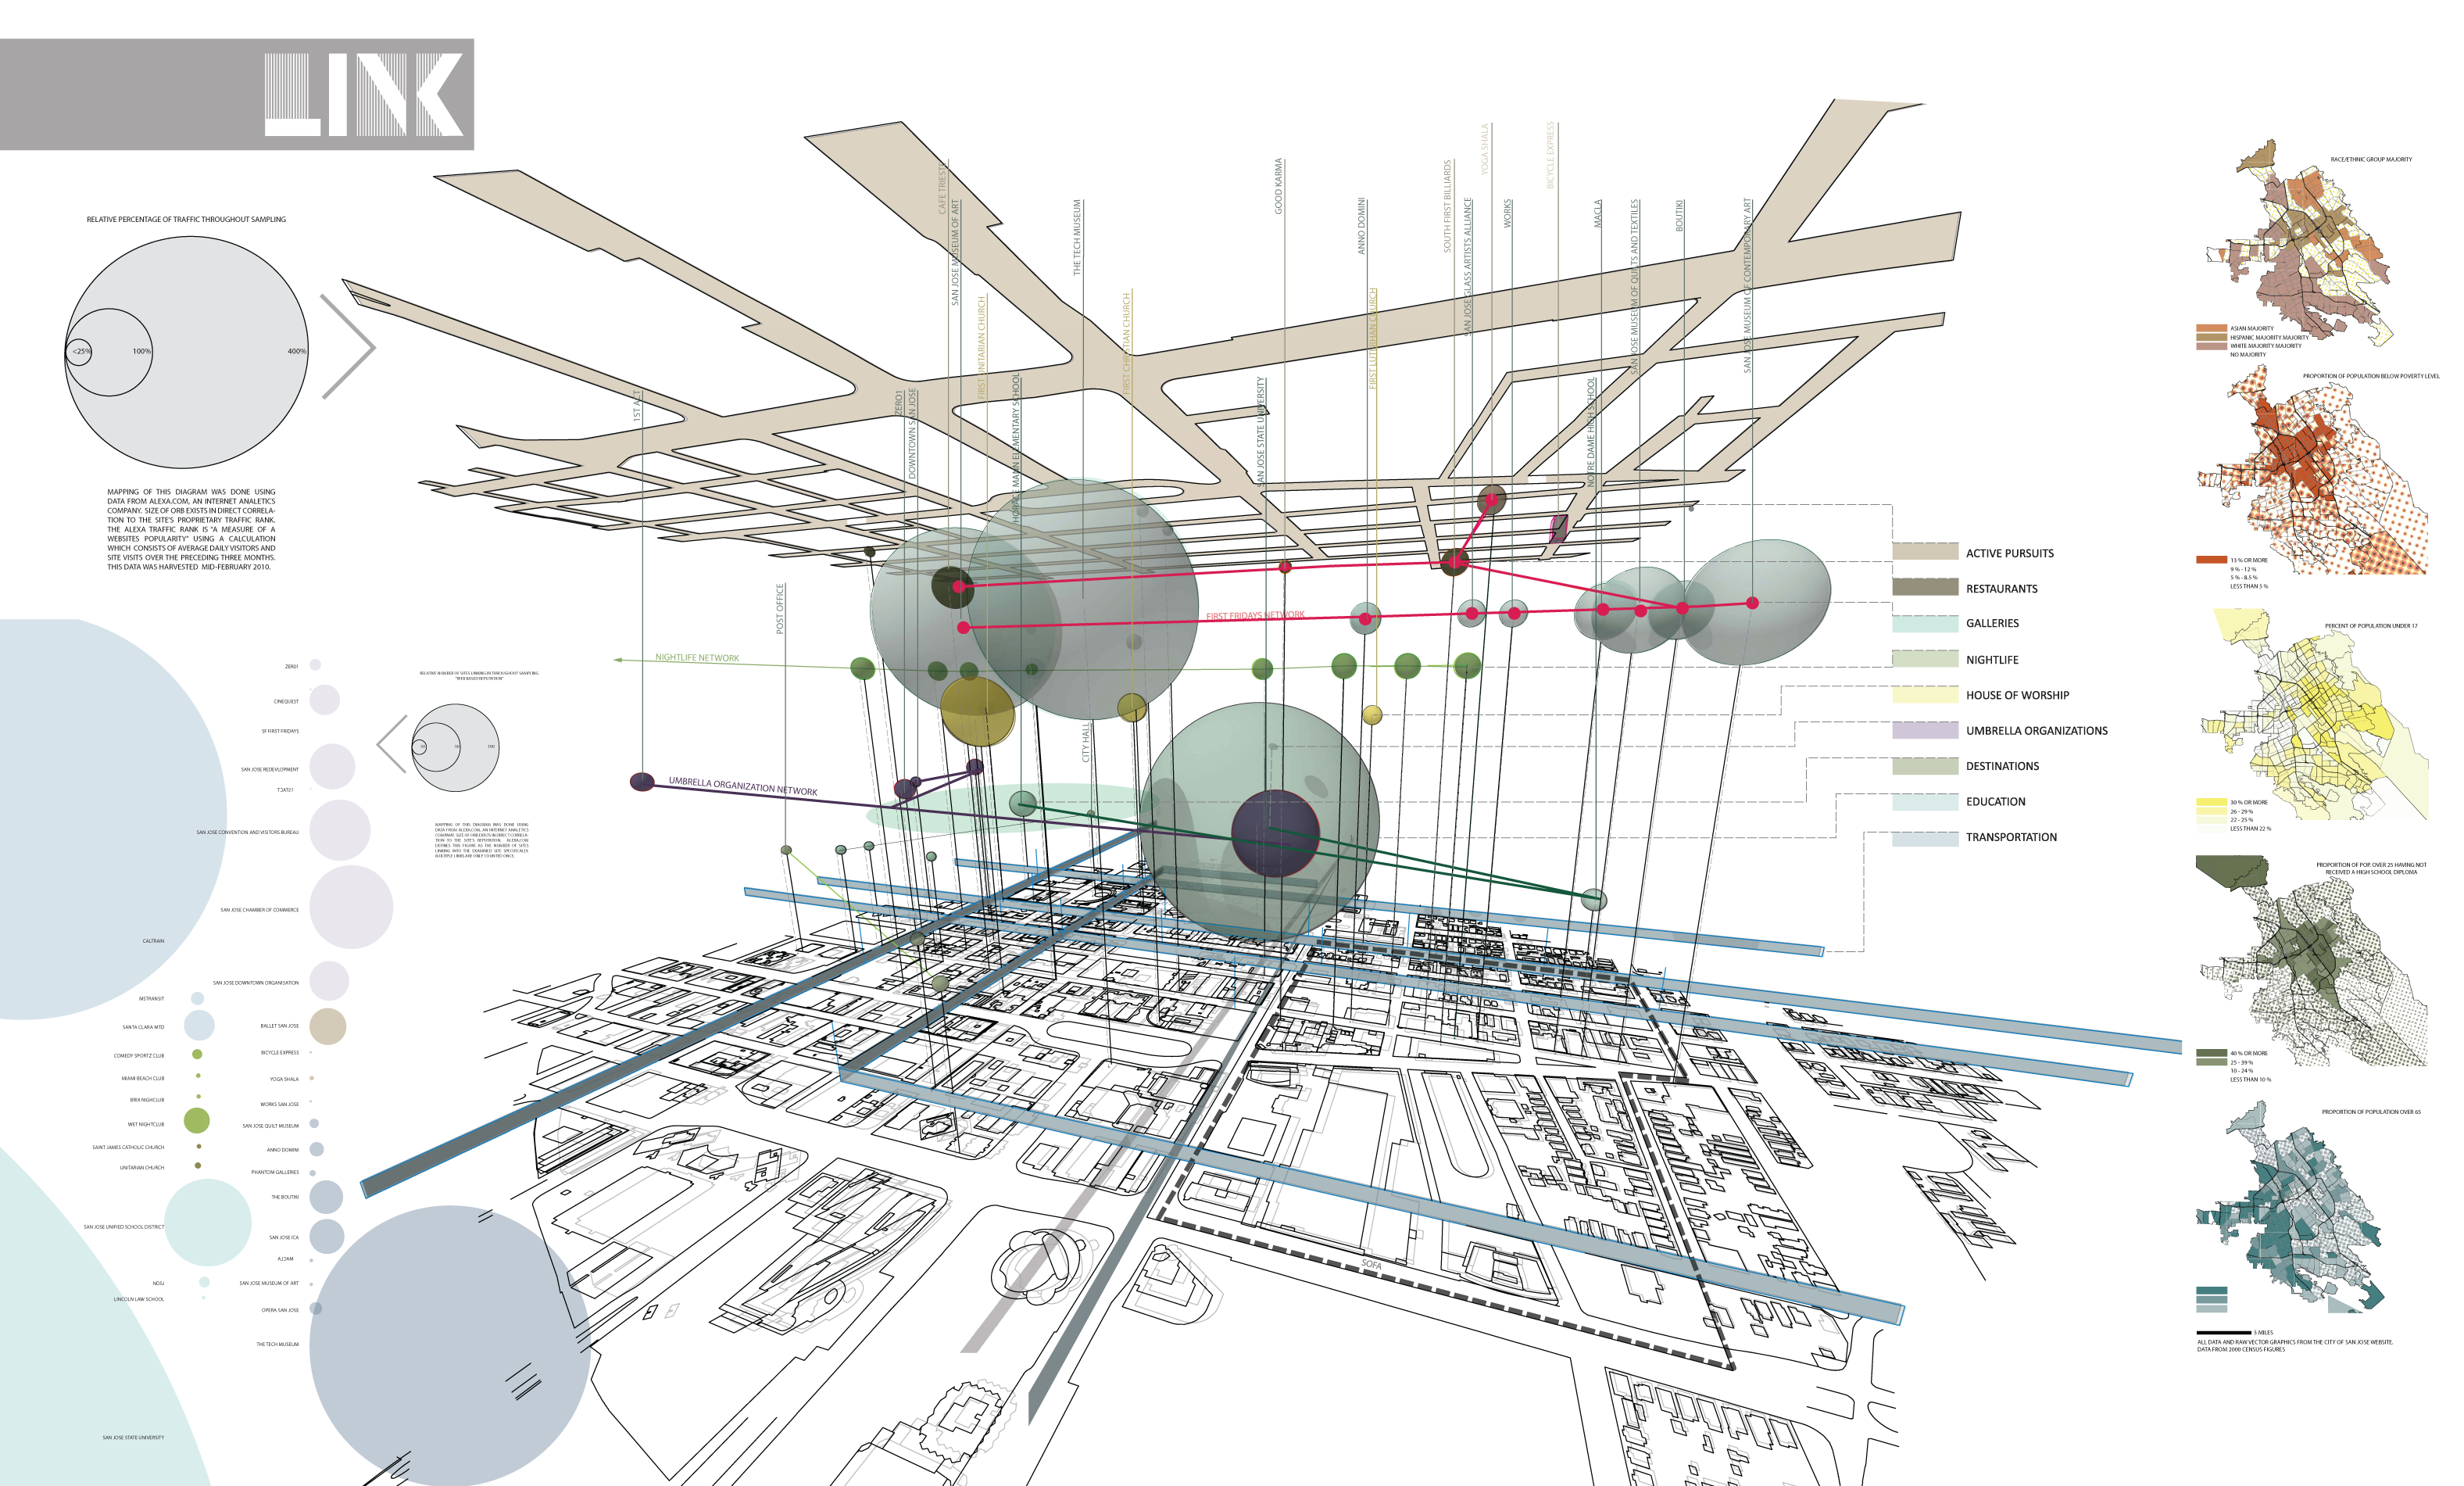
Please see these examples of some visualization techniques. *Always ask yourself if you can DIFFERENTIATE line types, line weights, color tones, etc. Balance the image. Your eye should go to the data / information, not the reference background.
Raster images often have techniques of layering. Consider working in Illustrator and then placing a linked Photoshop file for raster content.
*Please open link at end of this post.

Interboro Partners – various

RCR – I googled “RCR Siteplan”


BIG – various


Cantrell Holzman –

Downsview Park – OMA and Bruce Mau

Stephen Maher and Zeta Fernando – UO


Morphosis – Urban Design

ARO – Rising Tides
///
And this…
