07A Pre-final 8/1 + Final 8/4
(featured image credit: https://ajuntament.barcelona.cat/participaciociutadana/en/noticia/ideas-contest-to-design-the-barcelona-superblock-resolved_1045200)
TEMPLATE: Please use InDesign files 8-1/2″ x 8-1/2″ exported to 450 dpi.
The below outline is firm unless you get confirmation from me in writing otherwise. Please think about how people will understand the work. Decimals are actual slides. Monday’s review will help. Graphics coordination!! here
01 INTRODUCTION: Context, Problem and Purpose to Urban Health in Barcelona
1.1 Title: Two-word title; Authors; Icon/Image of Feeling
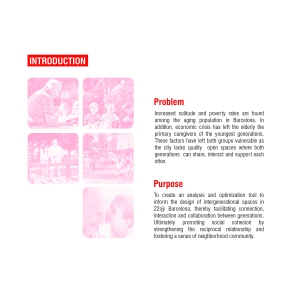
1.2 Purpose Sentences as typed paragraph:
- What is the problem/challenge of urban health in Barcelona today applied to Superillas?
- Who is affected (be as specific as possible);
- Why is it important, including social value?
1.3 Social Interaction Theoretical Framework: highlighted areas (This is originally from Rueda and Cynthia – add a headshot of them if you like)
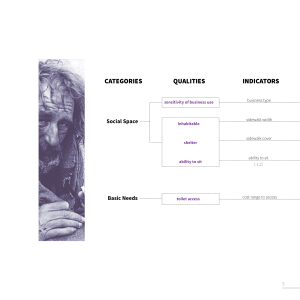
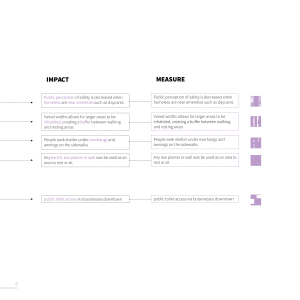
1.4 Chart from Idea, Categories, Qualities, Indicators, Icons (**this may need to take two slides to see the indicators)
02 BACKGROUND: Context or Storytelling (should have graphics)
2.1 Diagrams about topic: explain each categories in a list or diagram
2.2 Literature Review: 3 quotes and a thumbnail of the author or idea
2.2 Periodical Review: 2-3 article titles, etc with thumbnail
2.3 Comparative Statistical Graphs and charts: between Barcelona and a city you lived in (USA)
03 GRANADA
3.1 Albaicin North: Location Plan, Neighborhood plan, Placeta Plans
3.2 Albaicin South
3.3 Centro
3.4 Alhambra + Generalife: baseline observations, video with sound, textures/images as related to your interest (Icons)
04 BARCELONA
4.1 Tile page with 4 plans of Eixample z-line tool
05 QGIS City Plan – purpose to locating district (with diagrams about layers and sources of data)
5.1 City Scale Drawings – top 3 plans WITH names
5.2 Composite Analysis Drawings. Purpose: to location districts. Highlight or bullet point findings in margin.
5.3 Final Drawing with district options and clear final choice.
06 District Plan – locating Superilla via Ignacio’s Grasshopper tools
6.1 District Scale Drawings – top 3 plans WITH names
6.2 Analysis Drawings leading to Superilla selection
6.3 Superilla Drawing – show internal Organization – Label boundary streets
07 Human-scale Z-Line Tool
7.1 Quality / Indicator Plan 1
7.2 Quality / Indicator Plan 2
7.3 Quality / Indicator Plan 3
7.4 Composite Z-Line image – over Prototype area design (Possible GIF? data, data+design, design)
08 Circle Tool of Superilla and Baseline Comparison area
8.1 Circle Diagram WITH analysis layer over it and list of findings. **Leads to program and qualities (icons) used
09 Landscape Catalog Timeline
9.1 Simple analysis of key vegetation, animals and possible program over year (with weather and key social events)
9.2 possible 24 hr diagram (simpler)
10 Design Strategies
10.1 5m x 5m (+/-) units: your urban program (you are designing vibrant Superilla streets and not a park like below) and ecology that supports it
Kesey Farm Project Master Plan_SA UD (short version)
11 Prototype Street and Intersection: individual drawings below
11.1 2D plan as line drawing of ONE block length
11.2 Typical Street section
*** 3D model information added to detailed Z-line perspective with data (we can add more of these with time)
12 Unit Module Diagram (axonometric or plan)
12.1 Zoom to one moment
13 Eye Level perspective (possible GIFS, animations)
13. 1 Street Level Perspective of Human Experience: Initial surreal collage highlighting the urban phenomena
13. x Responsive Sensor Design: (also integrate with other slides) how to empower people with information in public space
would love to see ‘design data’ superimposed


