I started studying site effects on ground motions through the IRIS internship program at the USGS Earthquake Science Center in Menlo Park. I continued my project as a student contractor during the spring and summer of 2018. I wrote a paper about my results in BSSA. My inversion codes are available on my github.
κ0 and Broadband Site Spectra in Southern California from Source Model-Constrained Inversion
Alexis Klimasewski1†, Valerie Sahakian2, Annemarie Baltay1, John Boatwright1, Jon B Fletcher1, Lawrence M Baker1
- Earthquake Science Center, U.S. Geological Survey, 345 Middlefield Road, MS 977, Menlo Park, CA 94025
- Department of Earth Sciences, 100 Cascade Hall, 1272 University of Oregon, Eugene, OR, 97403
Abstract:
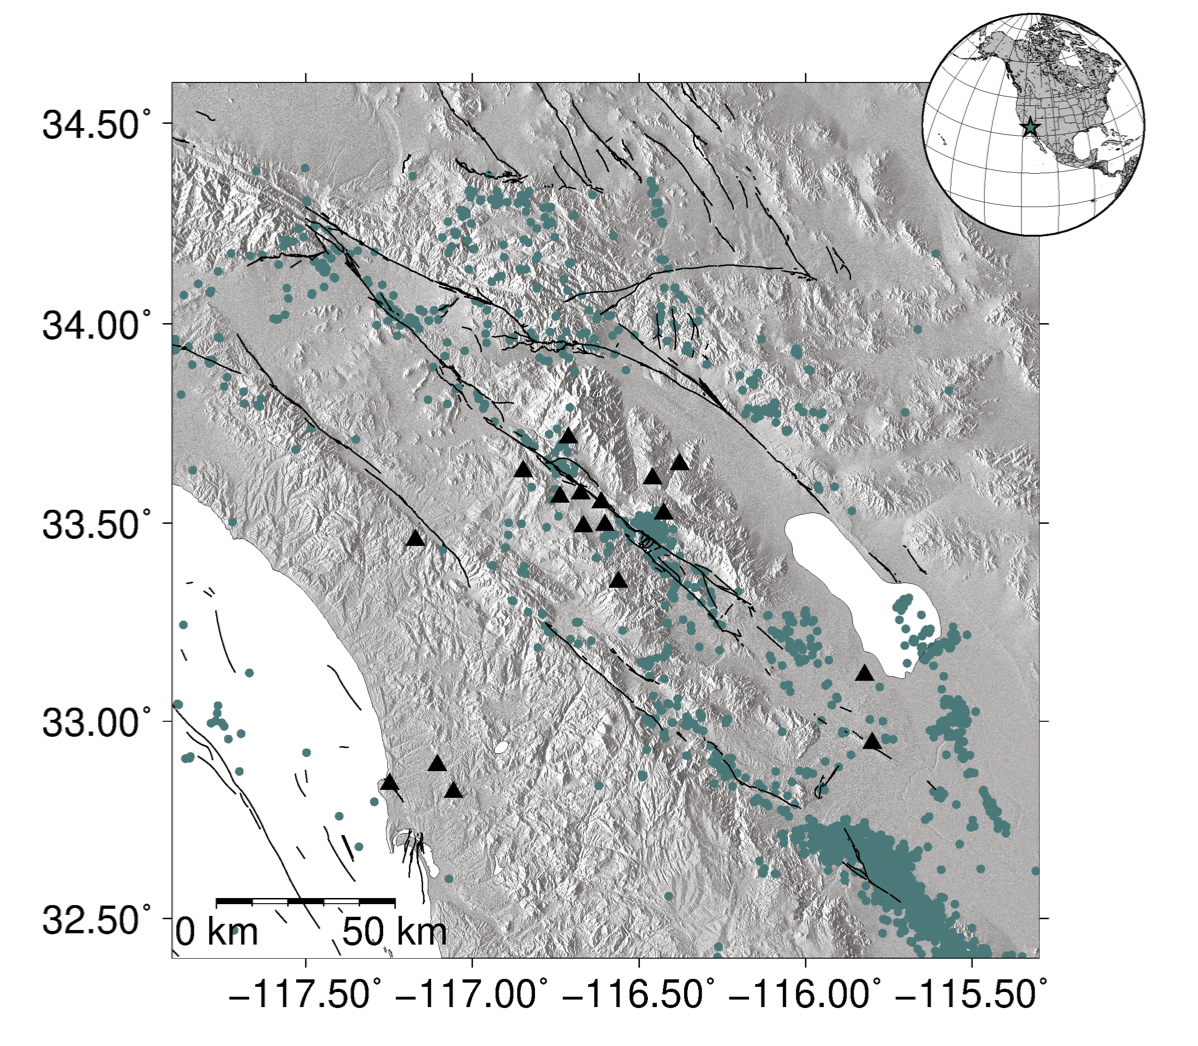
Ground‐motion modeling requires accurate representation of the earthquake source, path, and site. Site amplification is often modeled by Vs30, the time‐averaged shear‐wave velocity of the top 30 m of the Earth’s surface, though recent studies find that its ability to accurately predict site effects varies. Another measure of the site is κ0, the attenuation of high‐frequency energy near the site (Anderson and Hough, 1984). We develop a novel application of the Andrews (1986) method to simultaneously invert the spectra of 3357 earthquakes in Southern California into source and site components. These earthquakes have magnitudes 2.5–5.72 and were recorded on 16 stations for a total of 52,297 records. We constrain the inversion with an individual earthquake, demonstrating the most Brune‐like shape to preserve the site spectra. We then solve for κ0 site amplification at each station in three frequency bands: 1–6 Hz, 6–14 Hz, and 14–35 Hz. The resulting values of κ0 range from 0.017 s at ANZA station PFO to 0.059 s at ANZA station SND. We compare our results to values of site κ0 from other studies, as well as site residuals from ground‐motion prediction equations. We find good agreement between our site κ0 and previous studies in the region. We find that κ0 and high‐frequency site amplification (14–35 Hz band) correlates well with independent site residuals, making it a good first‐order approximation for the effects of site attenuation or amplification on ground motion.


