Assignment 2
Questions:
In 3-4 sentences, describe the patterns you observe form the annual bicycle count data.
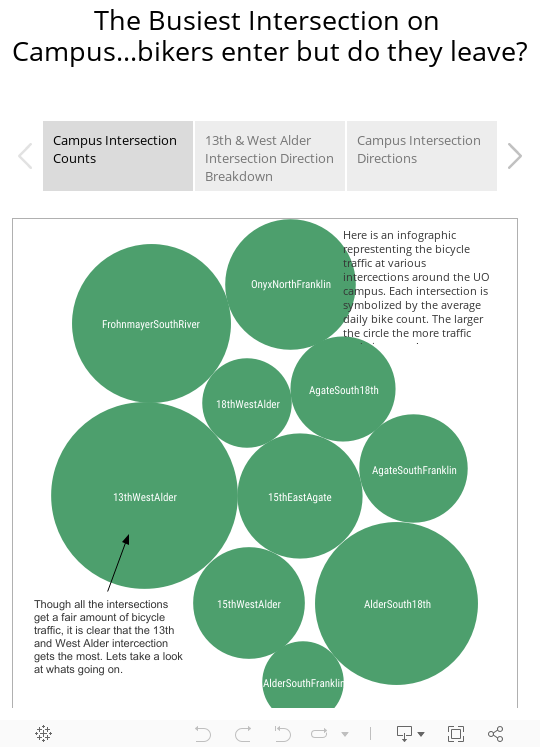
My story focused on the average weekday traffic at a particularly busy intersection near campus. I observed that people tend to more often enter campus from this intersection and then leave through some other route. I looked at the traffic patterns of the other intersections around campus and noticed that several of them had the opposite traffic patterns which could explain were the people tend to leave campus from. There were also lots of other patterns outside of my story I noticed when tinkering with the data. Some of these include: weekends have less traffic, bike traffic is highest in the fall, and there tend to be less people bicycling when its cold and rainy.
In 3-4 sentences, explain why you selected the specific temporal resolution to display the bicycle count data
I choose to use the data set as a whole (3 years collected data) or broke the data up in to weekday averages. This way there limited gaps in the data. When using a small temporal resolution the display was messy and difficult to interpret. Also several of the days were missing observations all together. If the temporal resolution was to big the data display was to broad and not very useful.
In 3-4 sentences, explain how filtering the data by location changes the pattern(s) you are seeing.
Filtering was very useful for creating relevant data displays. Adding the campus locations filter changed the patterns seen in the overall data. For example: when looking at the average weekday traffic for the unfiltered data the weekends have higher bike counts, but if you apply the campus locations filter you will see less bike counts on weekends relative to the weekdays.
In 7-8 sentences, describe what survey or sensor data would be needed to elaborate/clarify/expand on your findings from this data set.
A sensor system that tracked individual bikes would be useful to expand on my the findings. That way I could actually see where a bike entered and left campus, rather than just assume that most people leave by the same way they entered. Adding more sensors to sidewalks and other paths would be useful to because bicyclist don’t always stick to the suggested routes. My display is likely if full of error because it doesn’t factor in these other routes. Another potentially useful sensor would be one that tracks bikes lock up on campus. Then I could look to see if people are leaving there bikes on campus for different amounts of time depending on there activities. An interesting thing look look at would be the late night scene on campus. Looking to see if people leave their bike overnight rather then bike home intoxicated after one to many jello shots at Tay’s.
In 3-4 sentences, explain the limitations of the CLMPO data set.
The data was not collected consistently. There are huge gaps in the data where the senors were only active at a certain location for a limited time. When you look at the data in a small temporal resolution it is really ugly and irritating to work with. There are also other data that would be useful if added to the data set. In class we talked about how people tend to bike less if the weather in the morning is crappy. I think it would be really interesting to add a morning weather field to the data set and see if its true.
Leave a Reply