I did not specifically address the design and creation of infographics, but check out these resources for helping you think about creating dynamic visualizations to go along with your presentation of your research.
Edward Tufte: http://www.edwardtufte.com/tufte/ (where I got the visualization of Napoleon’s 1812 invasion of, and retreat from Russian)
Figurative Map of the successive losses in men of the French Army in the Russian campaign 1812-1813. Drawn up by M. Minard, Inspector General of Bridges and Roads in retirement. Paris, November 20, 1869. ——————- The numbers of men present are represented by the widths of the colored zones at a rate of one millimeter for every ten-thousand men; they are further written across the zones. The red [now brown] designates the men who enter into Russia, the black those who leave it. —— The information which has served to draw up the map has been extracted from the works of M. M. Thiers, of Segur, of Fezensac, of Chambray, and the unpublished diary of Jacob, pharmacist of the army since October 28th. In order to better judge with the eye the diminution of the army, I have assumed that the troops of prince Jerome and of Marshal Davoush who had been detached at Minsk and Moghilev and have rejoined around Orcha and Vitebsk, had always marched with the army.
2008 Election State Results. Source: The NY Times (Click on the image for a larger version.)
2008 Election County Leaders. Source: The NY Times (Click on the image for a larger version.)
2008 Election Voting Shifts compared to 2004. Source: The NY Times (Click on the image for a larger version.)
2008 Election County Bubbles adjusted to population density. 4. Source: The NY Times (Click on the image for a larger version.)
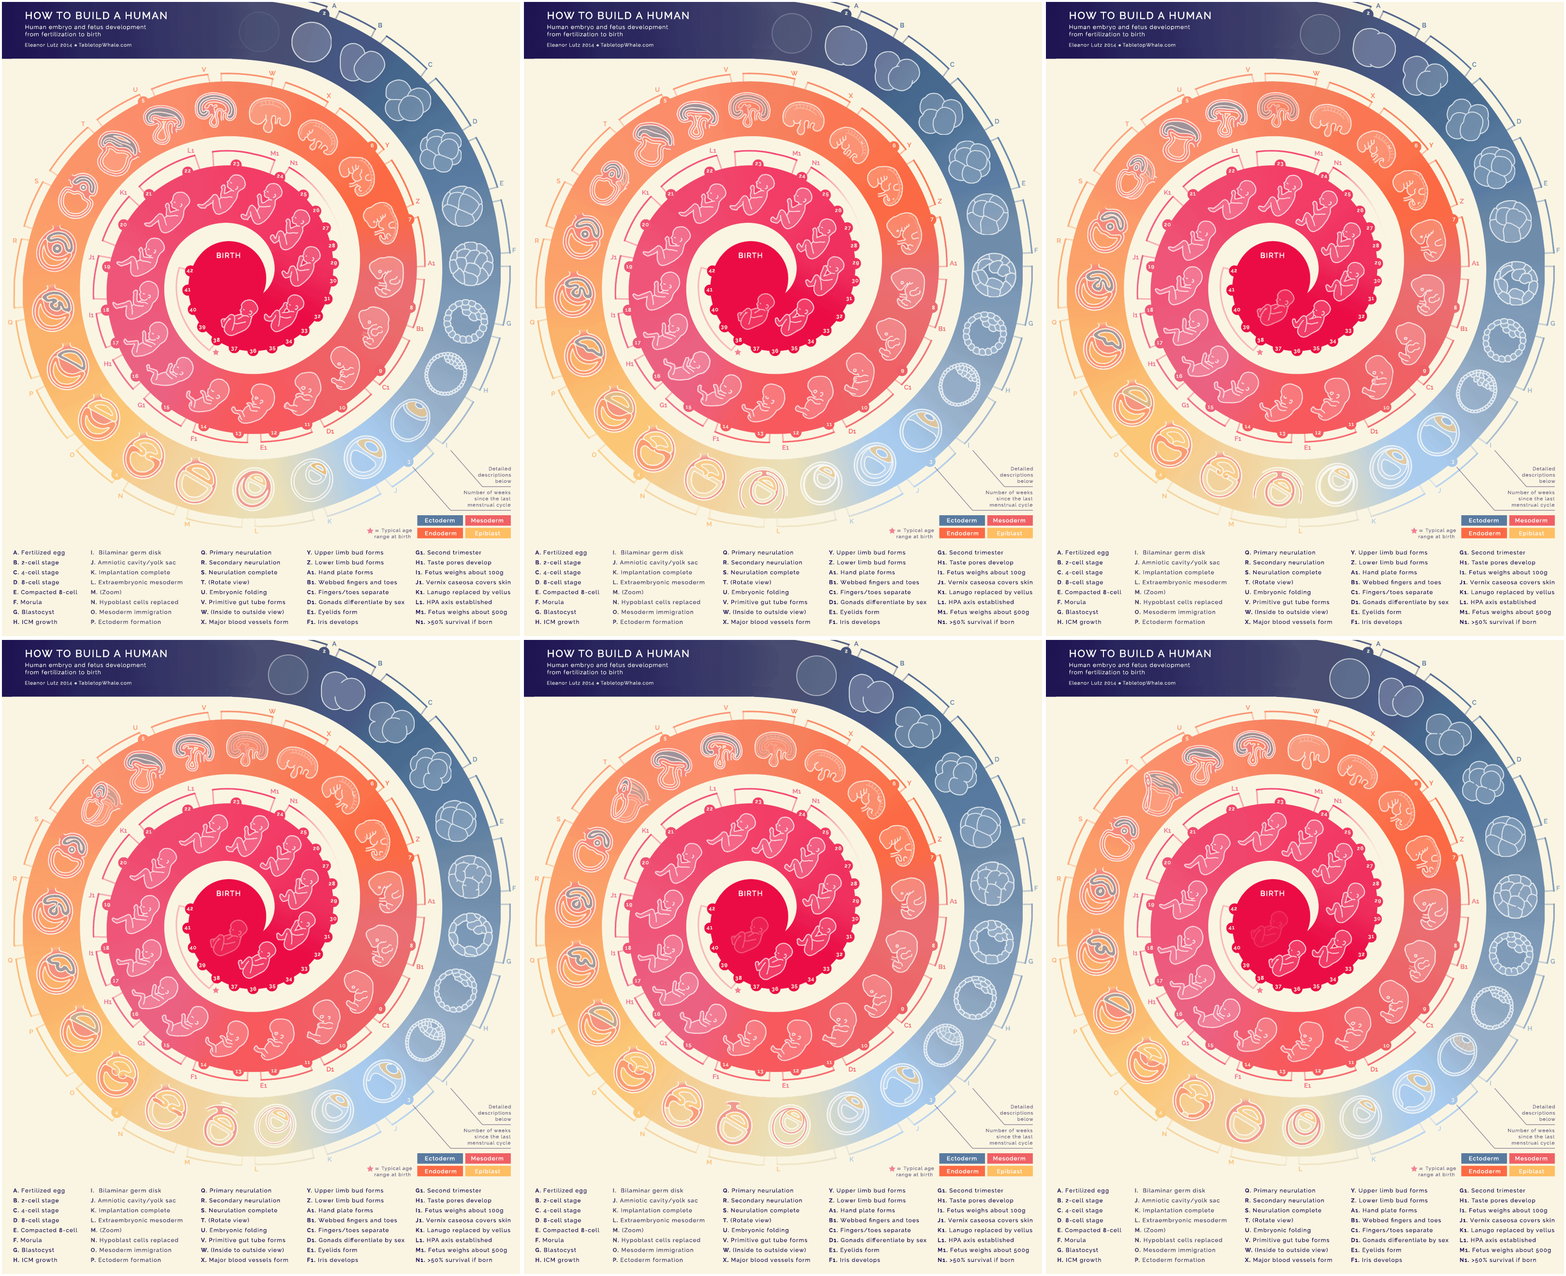
“How to Build a Human by Eleanor Lutz (Mini and Mobile Visualization) charts human embryo and fetus development from fertilization to birth through 44 animations that are nine frames each.”
Strong class session today, everyone. It’s great to see where your project ideas are headed and how they are unfolding. Keep modifying your ideas from today’s worksheet. Further define the audience, the take home messages, etc. as well as how you will lay out your blog sites making them engaging and interactive. What is the story you want to tell? How will you tell it? And, to whom?
A few other reminders:
1) Get your tickets for the production of Silent Sky at Oregon Contemporary Theatre (see prior email for how to order)
2) Prepare your introductory searches on green chemistry, life cycle analysis, and the Nike Making app before our guest on Thursday. Details are outlined in a prior blog post as well as an email from this past weekend. This will be an engaging hands-on session.
3) Make certain you have completed your journals for the following:
a) our session with Sierra Dawson,
b) reading response to the packet article by Rau
c) follow-up for how you might apply ideas of data visualization from today’s class session
4) Work on Report 4 and Creative Display 2 (next draft of each) for Week 9. These should be 3/4 to 7/8 complete by that point. You will have final, more formal presentations to a public audience the Thursday of Week 10.
5) “Propose your own achievement” proposals are due by the end of this week, Friday. Keep working on your other achievements for the class whether you are excelling at journal writing, as an event specialist, resource librarian or super contributor to class discussions, etc.
6) A reminder that we are reviewing your annotated bibliographies and will have feedback about them for you soon.
Hi, for Thursday our guest speaker, Dr. Julie Haack has requested everyone do a little prep work. Below is her request, it is not a ton of work, but do think about showing off your research skills we have been working on this term.
We will go over this a bit Tuesday, but never too soon to start learning about these important topics! And the expectation coming into Thursday’s session will be that everyone has a basic knowledge of the topics as applied to Dr. Haack’s challenge.
-Robert
******
One of the greatest challenges in driving sustainability is inspiring individuals to select consumer products that do the least amount of harm to human health and the environment.
Making the “best” selection is often a complex and context specific process.
Our challenge for Thursday is to create data driven imagery that effectively empowers people to select consumer products that are consistent with a sustainable future.
In preparation for Thursday’s class, please use the Internet to explore the following topics and consider how each piece of information helps to form the foundation for our challenge.
•
Green Chemistry
•
Life Cycle Analysis
•
The Nike Making App
Henrietta Swan Leavitt working at her desk in the Harvard College Observatory – American Institute of Physics, Emilio Segrè Visual Archives http://photos.aip.org
Remember to refer to the email we sent about getting your tickets for the Silent Sky performance at the Oregon Contemporary Theatre.
Here are some resources for more about the performance:
How GREAT to draw, play with models, hold a real heart, discuss values around, and enact the action of the heart with Sierra Dawson in class today! I hope this helped you better understand intersections between the science behind an object, its aesthetic appeal, and the cultural values and meanings we place upon them.
Some of us feel more comfortable with this:
Drawing a representation of a human heart
Others of us are more comfortable with an animated model:
and still others of us love getting as close an approximation as possible:
even the “real” thing:
Human Heart from the University of Arizona’s Anatomy Explorer
Some of us (like Case) want to know about growing alternative body parts,
Additionally, Robert and I continue to challenge you to define your project in one word or one short phrase. Why is that the central idea of your project? And then, if you called your best friend, a parent, a coach, what would you concisely tell them (1-2 minutes) about the project and what it means or how it is relevant to the world today. Or maybe, you consider writing them a one-page letter, email, or short text about the project. How would you tell them what you are doing and why it matters?
We look forward to reviewing Report 3/Your annotated bibliographies helping define more of the science, art history, and cultural implications of your projects.
Assignment Reminders:
Journal 13: What did you learn today from Dr. Dawson? What did you learn from the stories and examples she shared? How will you apply these ideas to your term project? To your life? Due by 10a.m., Tuesday, Feb. 16.
Journal 14: Write & Post your reading response for the chapter by Rau (in your course packet). Due by 10a.m., Tuesday, Feb. 16. Come prepared to work on your term project, particularly your blog sites. Bring computers or other devices for this work.
As always, let us know if you have questions about your project, your individual work in the course, going to the theatre event in a few weeks, or anything else related to the class.