IMPORTANT Goal for this Week on Project Sites

Hi, okay so we have been fairly flexible so far with directing you in your projects.  But now is the time to really push yourselves on your project sites! We are down to the deadline. Next Tuesday = Your next presentation of your Creative Display (at least 3/4 complete). Then, the Thursday of week 10, we’ll have faculty, staff, and students from across campus joining us.  You will want to be ready with a professional presentation for this public audience.

We have noticed a good amount of the project sites continue to be at the default title and tagline level.   So for your assigned goals for this week (as in have this done by the end of the day Friday, February 26th):

1.  If you have not done so, make sure your site title reflects your Final Project research and/or Creative Display title.   Your site title should NOT be “Art Meets Science”  or “AAD 199” by the end of the week.

2. Get rid of the Tagline “Just another University of Oregon Sites site”!  Your site is not just another site.  It is unique and awesome!   So think about an unique and awesome Tagline.

To complete #1 and #2 above you need to go to your Dashboard and Settings and General, change the Title and Tagline here and Save.

3.  Start making your project site Pages.  What do we mean by this? By the end of the week, there should not be any “Sample” pages on your site. You should have fully actualized Pages in which you are adding your research and Creative Display information.   How to do this?  See Jacob’s and Cortelle’s beginning work on this: https://blogs.uoregon.edu/jarmasaad199/ and https://blogs.uoregon.edu/cortelleaad199/

Robert sent an email out with the subject line “AAD 199: Setting up Pages and Menus on your sites” for instructions about setting up your Pages and Menu.

BONUS Goal:  After you set up your content Pages, begin add your content: research writing, Creative Display descriptions, overall project narrative (you have your introduction paragraph done from last week’s work session), images, videos, etc.

If it it helpful, plan out a timeline/schedule of completion for yourself.

Questions?

Let us know!

Best,

Robert and Julie

Follow-up to Day 13: Part Two!

Hello_Kitty_logo.svgData Visualization, Infographics, and other Cool Visual resources:

I did not specifically address the design and creation of infographics, but check out these resources for helping you think about creating dynamic visualizations to go along with your presentation of your research.

Figurative Map of the successive losses in men of the French Army in the Russian campaign 1812-1813.

Figurative Map of the successive losses in men of the French Army in the Russian campaign 1812-1813.
Drawn up by M. Minard, Inspector General of Bridges and Roads in retirement. Paris, November 20, 1869.
——————-
The numbers of men present are represented by the widths of the colored zones at a rate of one millimeter for every ten-thousand men; they are further written across the zones. The red [now brown] designates the men who enter into Russia, the black those who leave it. —— The information which has served to draw up the map has been extracted from the works of M. M. Thiers, of Segur, of Fezensac, of Chambray, and the unpublished diary of Jacob, pharmacist of the army since October 28th. In order to better judge with the eye the diminution of the army, I have assumed that the troops of prince Jerome and of Marshal Davoush who had been detached at Minsk and Moghilev and have rejoined around Orcha and Vitebsk, had always marched with the army.

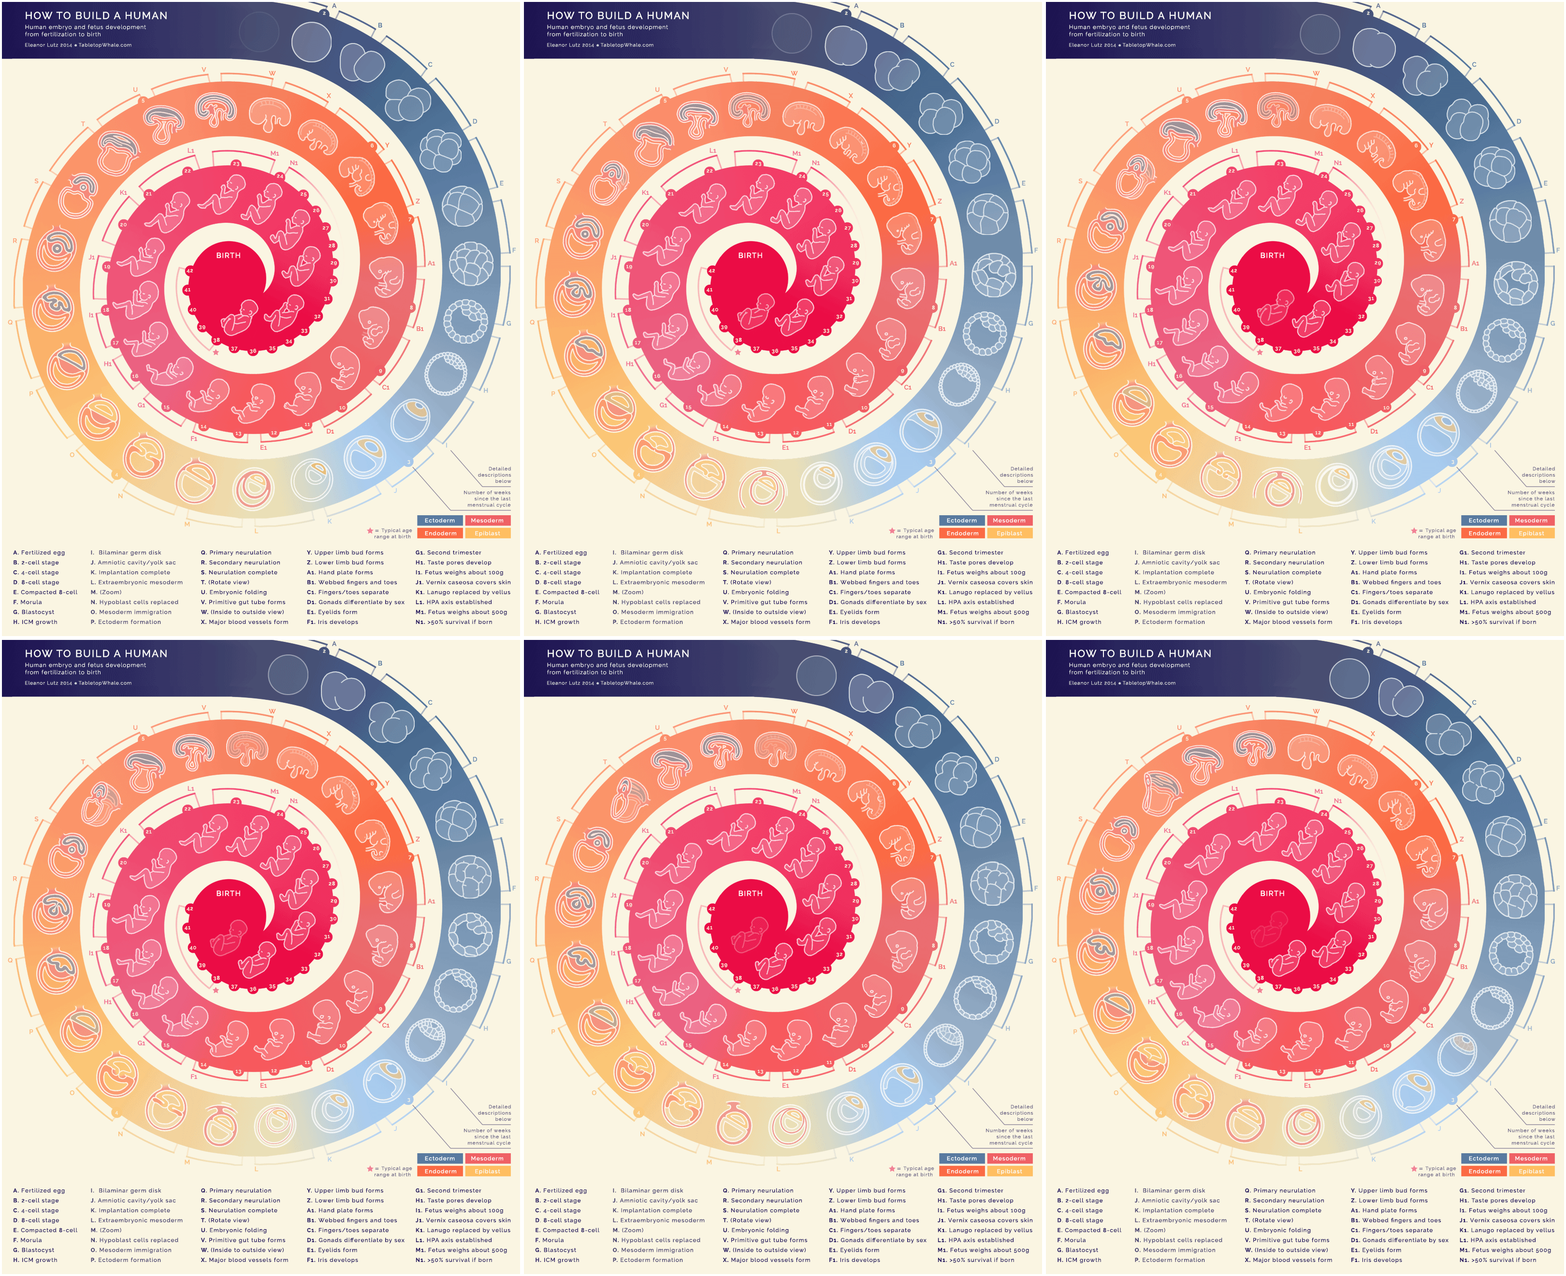
“How to Build a Human by Eleanor Lutz (Mini and Mobile Visualization) charts human embryo and fetus development from fertilization to birth through 44 animations that are nine frames each.”

Prep Work for Guest Presenter this Thursday (2/18)

All,

Hi, for Thursday our guest speaker, Dr. Julie Haack has requested everyone do a little prep work.  Below is her request, it is not a ton of work, but do think about showing off your research skills we have been working on this term.

We will go over this a bit Tuesday, but never too soon to start learning about these important topics!  And the expectation coming into Thursday’s session will be that everyone has a basic knowledge of the topics as applied to Dr. Haack’s challenge.

-Robert

******
One of the greatest challenges in driving sustainability is inspiring individuals to select consumer products that do the least amount of harm to human health and the environment.

Making the “best” selection is often a complex and context specific process.

Our challenge for Thursday is to create data driven imagery that effectively empowers people to select consumer products that are consistent with a sustainable future.

In preparation for Thursday’s class, please use the Internet to explore the following topics and consider how each piece of information helps to form the foundation for our challenge.


Green Chemistry

Life Cycle Analysis

The Nike Making App

******

Remember Get Your Silent Sky Tickets!

Henrietta Swan Leavitt working at her desk in the Harvard College Observatory

Henrietta Swan Leavitt working at her desk in the Harvard College Observatory – American Institute of Physics, Emilio Segrè Visual Archives http://photos.aip.org

Remember to refer to the email we sent about getting your tickets for the Silent Sky performance at the Oregon Contemporary Theatre.

Here are some resources for more about the performance:

Silent Sky show poster