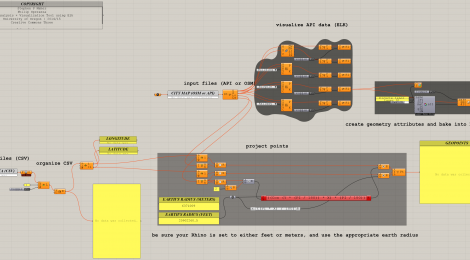
CSV / ELK Grasshopper Definition: UPDATED
Good morning, everyone. I spent some time yesterday cleaning up the CSV/Elk GH tool I showed in class last week. It includes the following:
- Input cluster (CSV and OSM/API).
- Data organization cluster ([ShiftList] and [ListItem] components). You will have to play with this with your own spreadsheet and data; I used a simple spreadsheet with only two columns (latitude and longitude).
- Point projection cluster. (I cleaned this up to make the math a bit simpler, but it now requires you to use either feet or meters as your Rhino units.)
- OSM/API data visualization (ELK).
- Create attributes and bake geometry cluster (HUMAN plugin). I included this for only one of the ELK output geometries, so you can understand how it works. It’s fairly straightforward.
Note: I took out the Z-line visualization. I think it’s important you understand what’s happening on “back end,” so to speak. Once you can control the data, visualizations will seem like cake. I’ll work with you later in the term on how to create killer visuals (if you even need my help).
You can find the new script in the course folder:
\\aaafileserver.uoregon.edu\Courses\2015-Winter-ARCH523-Speranza\04_CSV ELK_Social Tool\01_ARCH523_2015_SOCIAL_MIXER_TOOL
Hope you enjoyed the data collection trip to PDX yesterday.


