
Group Assignment: Urban Analysis and Design Project, Due Tuesday
SPREAD I (11″ x 17″, landscape)
Page 1 (left page, 8.5″ x 8.5″) Title and Author
- Title: two words
- Author
Page 2 (right page) INTRODUCTION: Purpose to Problem (thesis),
- Title: two words (ex. operation + context)
- Purpose Paragraph: What is the problem, how applied to Superillas and social interaction?; who (be as specific as possible); Why important including social value ; (highlight key words)
- Social Interaction Qualities, Choose 1-2 (Social, Demographic and Infrastructure). Is each an urban characteristic or a an urban phenomena (human or natural)?
- Indicators, choose one for each quality.
- Geometry Inputs, Choose 1-2 (parcel area, height, sidewalk width, rail, bike, waterway) Hint: see OSM/ELK
- Not optional: small thumbnail or narrow texture of swatch of qualitative image/material perhaps hinting at final output.
- Visual Language, quantitative method, develop visual language of the qualities to measure and compare parametric variations
- graphic hints: set the tone for the unit and highlight color here
.
SPREAD II
Page 3 (left page) BACKGROUND: Context
- Outline: Purpose / Urban Design Criteria / Indicators (ways to measure)
- Literature Review: Theory of Urban Analysis Tools and Urban Design related to thesis (citations/quotes)
- Research 22@ / Barcelona problems: 1- 3 recent articles as quote or informational statistics (El Periodico, El Pais, other) (citations)
- UO Case Studies (optional), relevant with operations, workflow diagram, their purpose and plugins (citation as one image)
- Comparative Statistics: Infographics begin here and continue to next page
- graphic hints: set quantitative baseline big picture to small picture indicators to follow
Page 4 (right page) BACKGROUND: Quantitative and Qualitative Baseline (statistics and info-graphics)
- Qualitative media: swatches of your urban design characteristics (criteria)
- Abstract scientific data: measurement of basic relationships, statistics related to measure quality (ex. 6:1 water to urban farming recommendation). Abstract and Baseline models.
- Context: Catalan/Barcelona/ 22@ 10/10/10, BCNecologia_Presentacio Superilles, Patrimonio (Generalitat/Ajuntament) vs comparative city such as Portland, Madrid, EU. Can you find relevant law or ordinances in Barcelona, Catalunya, Spain or the EU?
- Timeline: Identify time relevance in periods (hours, day, week, year, years) Corner Collage / Minard
- Audit: What existing projects existing around your idea? What plugins would be helpful (show their icon)? What are the inputs and outputs (list as words).
SPREAD III
Page 5 (left page) Visual Language and Dataset: Organization and Geometry
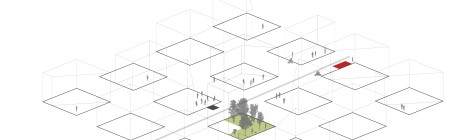
- Unit, series of 1″ x 1″ abstract block (later real-world) (block, right-of-way or both): describe the block unit, parcel unit, etc. (plan or 3D) (Quantitative method, develop visual language of the qualities to measure and compare parametric variations) **Rhino and Grasshopper
-
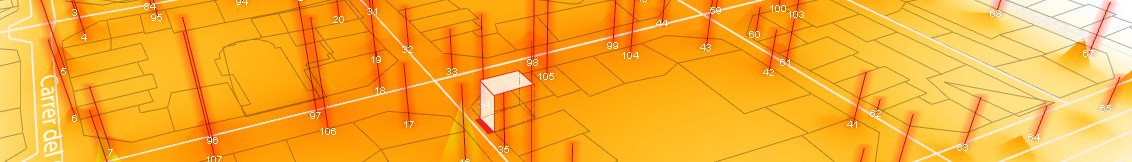
- Real-World Block Study- Choose a block in the proscribed 22@ area. Review selection with me. More typical blocks are in the center. Diagram it. Document- one relationship at a time- the differences within the block. Methods: Axonometric, plan and section. **later: Real-World 3×3 Block Area Study
- Parameters: show parameters individually over the same unit background (relate or restate context of 10/10/10 historic)
- Parametric Urban Characteristics (Criteria) and or Indicator Evolution Diagram: (Identify 6-7 parameters, later refined to 4-5)
- External Force of New Dataset Information source: (citations perhaps with * # legend):
- New Off-site virtual from Google Maps, Google Street View, Bing, Yelp, and other virtual sources off-site observation)
- Existing Off-site Datasets (OpenStreetMap.org, Resources – 22@ PDFs for zoning use and open space, GIS Shape files)
- On-site Dataset Master CSV from Summer 2014 (see AAA Course Server)
Page 6 (right page) Analog Parametric Tool, 1-2 pages
- Location Plan : location your test areas in 22@ or Barcelona (see Guallart drawings)
- Outline: Purpose / Urban Design Criteria / Indicators…Measurement translations (number, types and or rating systems)
- Parametric Method: Outline or list any GH plugins, Identify possible plugins to learn (HUMAN, ELK, GALAPAGOS, DIVA)
SPREAD IV-V
Parameters (some of you may be able to combine two parameters in a page, etc.)
Page 7 (left page)
- Parameter 1
Page 8 (right page)
- Parameter 2
Page 9 (left page)
- Parameter 3
Page 10 (right page)
- Parameter 4
.
SPREAD VI-VII
Page 11 (left page) ANALYSIS and FINDINGS
- GH Output: Findings, Emergent patterns
- GH Parametric Formula Diagram: Diagram of your Grasshopper Definition

I’m excited to share my experience with the outstanding “Do My Assignment” service provided by Global Assignment Help. Their dedication to excellence and their global reputation make them a top choice for students worldwide. As a professional in academic writing, I’m honored to be part of their team, where we work tirelessly to deliver high-quality assignments tailored to each student’s specific requirements.