
2.0 Mid-Term: Humanistic Data @ Granular Scale
Review work together
<<how do you bring meaning to data? humanistic. integration or fade between?
Add the dimension of TIME! What is the granular differences we can find?
- Title + Description of Problem
- Concept Imagery / clips
- Theory / Chart
- Individual data maps with icons (must use agreed upon neighbhood areas).
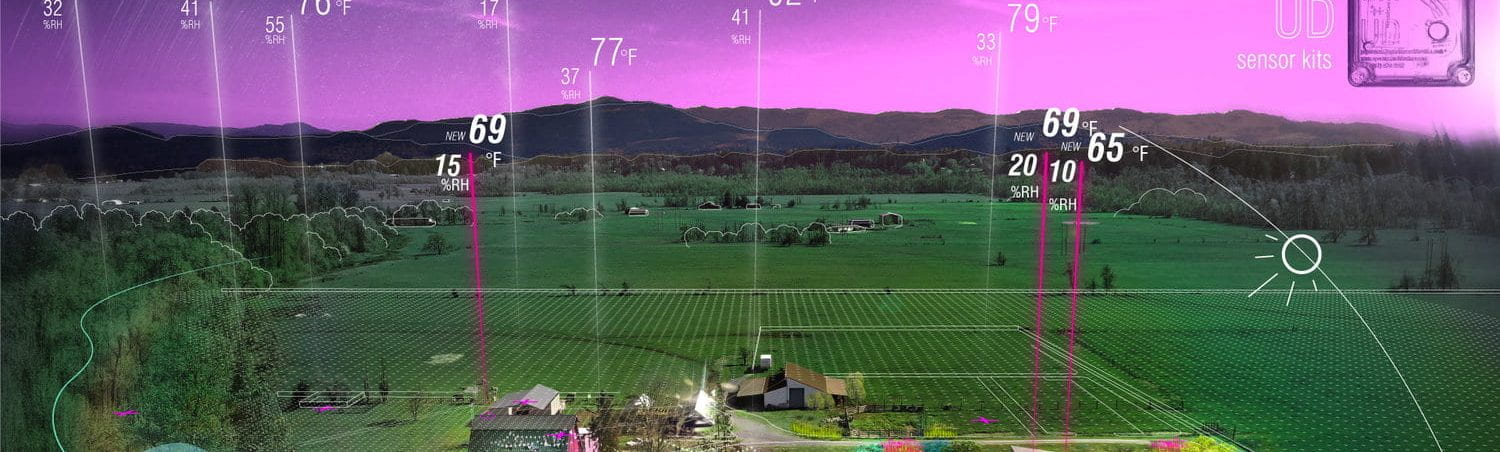
- composite aerial view or perspective. fade in satellite or aerial photo possible. Illustrate in a humanistic / fun way
- Timeline – how to find indicators about time?
- story board time of issue and time of presentation
- Rendered stills with floating data. eye level perspective from at least one person in the group.
- **overall movie presentation and or GIFs of axon / perspective
- Adobe Premiere / Animation via Enscape or Lumion with data (text, #s, color)
- baseline comparison / contextualization
- Auto Entourage plugin by Vincent Mai (presentation forthcoming) as surreal population.
We are at really fine granular scale. Otherwise see MIT senseable City Lab or GSAPP Spatial Information Design Lab – but we are more at a human scale like Jing Liu’s studio at Columbia and playful.
https://www.moma.org/momaorg/shared/pdfs/docs/learn/courses/MillionDollarBlocks.pdf

MIT Senseable City Lab

Interboro Architects
https://www.archdaily.com/112643/interboro-partners-holding-pattern-winner-of-the-2011-young-architects-program-at-the-p-s-1


Social Code – Philip Speranza + Stephen Maher


Studio Gang


