-
GH LADYBUG LAB NOTES:
Topics To Cover:
- Downloading Ladybug
- Getting started
- General Components
Hello Everyone, welcome to Ladybug+!
Below is everything you will need to know to start using Ladybug for climate analysis.
Download Ladybug:
- To download Ladybug, visit food4rhino.com and search for “Ladybug Tools”.
- Download the most recent version of Ladybug. You may have to create an account for Food4Rhino if you don’t have an account already.
- Follow instructions in the downloaded file’s installation_instructions.txt for up-to-date installation instructions.
- Typical instructions: Download the ladybug-tools-VERSION.zip file from Food4Rhino. Right click on the .zip file and select Properties from the context menu. At the bottom of the window check Unblock if the option is available, click OK.
- Right click on the zipped file and select Extract. In the extracted folder, drag the install.gh file into an open Grasshopper window.
- In Grasshopper, follow the numbered prompts in Red. If any steps fail, ask your TA or GE for assistance.
- Once finished, close Rhino and Grasshopper and reopen. You should see Ladybug appear along the top of the component toolbar along with the other plugins in Ladybug Tools.
- Request assistance from your TA or GE if you have any trouble.
Getting Started:
- To start, open Grasshopper by typing “Grasshopper” in the Rhino command line or by clicking on the Grasshopper icon in the Rhino toolbar. A new window will appear once Grasshopper is open.

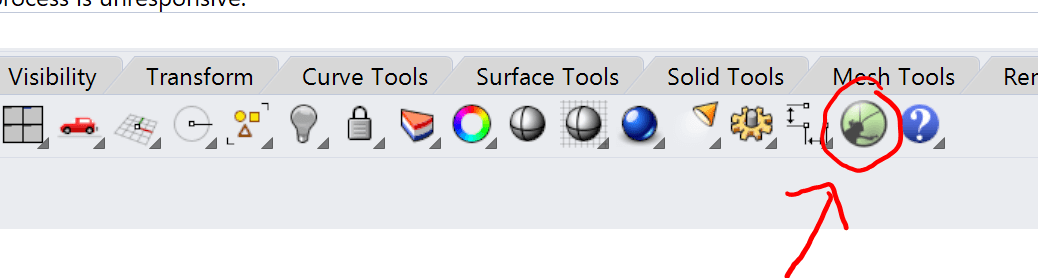
- Click on Ladybug at the top of the toolbar. You will know if Ladybug is installed correctly if it appears in the toolbar. If it does not appear, refer to the “Download Ladybug” section above.

- To start using Ladybug, navigate to the component toolbar section 0 :: Import on the left hand side. Click on the red circle with black arrow in the upper left hand corner. If you hover over the icon with your mouse it should say LB Download Weather. Click and drag into the canvas below.

- This component needs an input to run. Go to ladybug.tools/epwmap/ and zoom in to the pale red dot nearest to your area of study. For this tutorial we will use the TMY3 file nearest to campus. Click on the dot and press “Copy link to clipboard.”
- In Grasshopper, create a Panel component and paste the coppied link into the yellow window. Make sure to click out of the panel on the background of Grasshopper instead of pressing enter while the panel is still selected. Connect the Panel to the _weather_URL input on the DownloadEPW component.
- Next, we will need to read the downloaded file. In the 0 :: Import ribbon of Grasshopper select a LB Import EPW component. Connect the epw_file output of the DownloadEPW component to the _epw_file input of the ImportEPW component. This component will do much of the heavy lifting within Ladybug.

Ladybug Component Basics
Check out this tutorial for more information about how to use each component.
- Analysis Period – this component is useful for identifying the specific time period in which you want to conduct your analysis. Utilizing this component you can analyze the solar radiation on your building for the month of July or during the winter months instead of analyzing the entire year, which Ladybug defaults to. Click here for a description of the component’s icon, inputs, and outputs.

- Hourly Charts – this component graphically represents climate data or hourly simulation data. This is component is useful for creating a graphic that captures a holistic understanding of a specific location’s climate. Click here for a description of the component’s icon, inputs, and outputs.


- Windrose – this component creates a graphic to assist with understanding the direction and magnitude of wind for a given location. This information can help inform where operable windows could be placed on your building for passive cooling strategies or where you may need to block the wind for other reasons. Click here for a description of the component’s icon, inputs, and outputs.


- Sunpath – this component is used to find the position of the sun in the sky throughout the year for a specific location. This analysis could be paired with a shade analysis to see the impact of shadows cast by your building and surrounding objects (e.g. other buildings, trees, etc.) Click here for a description of the component’s icon, inputs, and outputs

- Incident Radiation – this component is used to analyze the amount of solar radiation that your building may be subjected to throughout the course of a year and a specific time period. This tool can help inform design questions such as where shading devices should be placed or if a roof plane is adequate for solar panels and how changes in these areas can improve the performance of your building design. Click here for a description of the component’s icon, inputs, and outputs.


- Psychrometric Chart – this component graphically represents the “comfort zone” for a given location based on dry bulb and wet bulb temperatures and relative humidity. Understanding this information can inform how you design the enclosure of your building or the temperature range you want to maintain for occupant comfort. Click here for a description of the component’s icon, inputs, and outputs.


