How to Install Grasshopper
***Grasshopper is pre-installed by default in Rhino 6 and Rhino 7+ ****
Introduction to Grasshopper
Grasshopper is a visual scripting editor for the Rhinoceros environment (i.e. an extension of Rhino itself). It allows for greater functionality, parametric control and data input/processing within the Rhino workspace. For all intents and purposes, you can consider the geometry created in Grasshopper “fake” – it is merely a preview – until it is “baked” into Rhino. More on this in a following tutorial.
You can also think of grasshopper as visual coding/scripting for designers!
Almost all Grasshopper capsules (officially called “components”) are functions that may have input(s) and output(s), or both. These transfer information to each other with wires, literally plugging into other components and flowing data between them. Inputs are on the left side, outputs are on the right, and the components are traditionally arranged left to right as if the code was “written.”
You can open grasshopper once rhino is open by typing “grasshopper” into the command line. A separate window will pop-up with the grasshopper interface. If minimized, this window will automatically move to the bottom left of your screen, the program itself doesn’t launch a new window in Windows and can appear hidden at first. Minimizing the Rhino window and maximizing it will also cause the Grasshopper window to appear on top if it is hidden.
INTRO VIDEO:
Topic_01: Grid + Number Slider
- In the ribbon, select the Vector Tab>Grid> Square (Square Grid)
You can also access a search function for the components in grasshopper by double clicking on the background of the window or pressing the spacebar. Searching is usually the preferred placement method but can take time to get used to how the names of certain components appear in the search dialogue.

- A small grey component appears with 4 inputs (left side: P, S, Ex, Ey) and 2 outputs (right side: C, P) Zoom in and hover your mouse over each individual inputs/outputs to see exactly what they represent. Note that right clicking on each input, the middle section, and each output will bring up different context menus.

- In the ribbon, select the Params Tab>Input>Number Slider. Essentially the number slider can be seen as a component that allows you to modify specific numeric inputs.
- In the case of our square grid, it allows us to parametrically modify the number of cells in the X and Y direction (Ex, Ey inputs from the Square Grid).
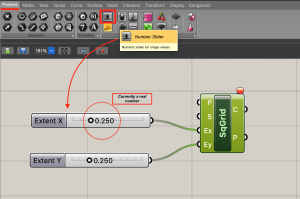
- In the number slider component, play with moving the slider from left to right. Notice that currently the number values are set to “real numbers” (i.e 0.250, 0.564) Since we are looking to adjust the number of cells in the x and y direction, we use whole numbers or “integers” (i.e. 1, 2, 10, 24)
- To change this we’ll need to right click on the number slider and in the menu that appears select Edit.
- In the slider Slider Section>Rounding notice currently the “R” (Floating Point Numbers) is highlighted. Instead select the “N” (Integers)
- In the Numeric Domain>Min/Max notice the “min” is currently set to 0. In this case it is okay since we cannot have a negative number define the number of cells in any given direction.
- We’ll need to however update the “max” value as it currently is set to 1. Double clicking the number allows you modify this value. We’ll change this to a numeric value of 1000. To save the numeric value click the green check mark.

- Click Okay to close the window
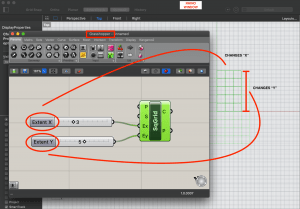
- Select the number slider you just modified; copy and paste it (Now you have two!!!)
- Next connect one of the number sliders to the “Ex“ input of the Square Grid; Connect the other number slider to the “Ey” input of the Square Grid
- Play with the sliders to see how the different inputs affect the grid.
**Alternately, you can double click and type commands in the grasshopper program to search components you want to use instead of finding them in the top ribbon.


Topic_02: Image Sampler
**YOU WILL NEED TO DOWNLOAD THE “Mount Hood” IMAGE FROM CANVAS PRIOR TO BEGINNING**
**YOU CAN SUBSTITUTE YOUR OWN IMAGE BUT IT WILL NOT ACHIEVE THE EXACT SAME RESULT**
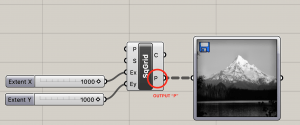
- In the ribbon, select the Params Tab>Input>Image Sampler (Image). A component appears with an exclamation mark in the center (Because currently there is no image set)

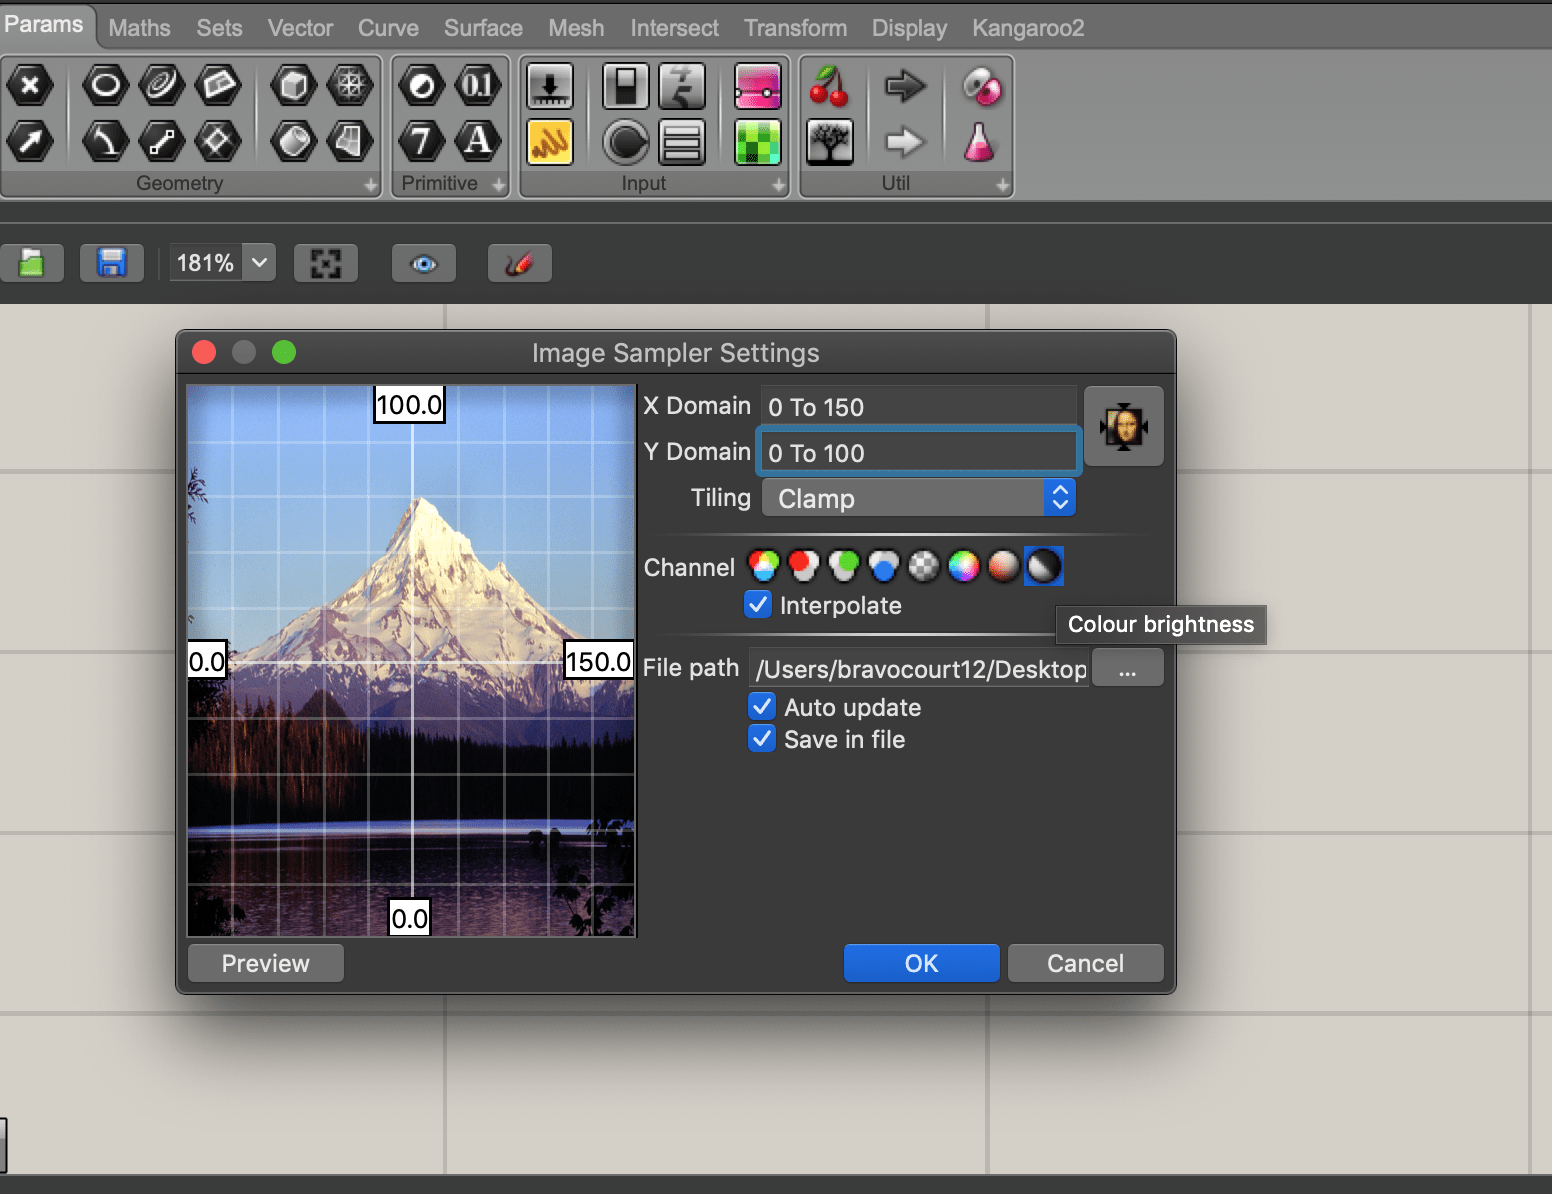
- Double click the exclamation mark, a window appears.

- In the File Path section in the window select the “…” button. A new window appears prompting you to specify an image from your computer. Navigate to your desktop and select the “Mt. Hood” image that you downloaded from the server earlier. Once you have selected the image, you’ll see a preview of the image to the left.
- In the Channel section notice that there are 8 different icons and if you hover over them highlight their specific function (i.e RGBA Colours, Red Channels, Green Channels, etc) The far right icon is labeled “Colour Brightness” Ensure it is selected, by clicking on it.


- In the Channel section ensure that the “Interpolate” option is checked
- In Tiling section click the double dropdown menu which is currently set to “Tile” and change it to “Clamp”
- Next we’re going to have to change the X-Domain and Y-Domain which both are currently set to “0.0 to 1.0” since earlier we changed our number slider to input numeric values up to 1000 well go ahead and change the X-Range to “0 to 150.0” and the Y-Range to “1.0 to 100.0” (Think of this in a way of pixel count in the x/y direction of an image.)
- Click OK

- Connect the “P” output of the Square Grid to the input of the Image Sampler

Topic_03: Circles + Multiplication Factor
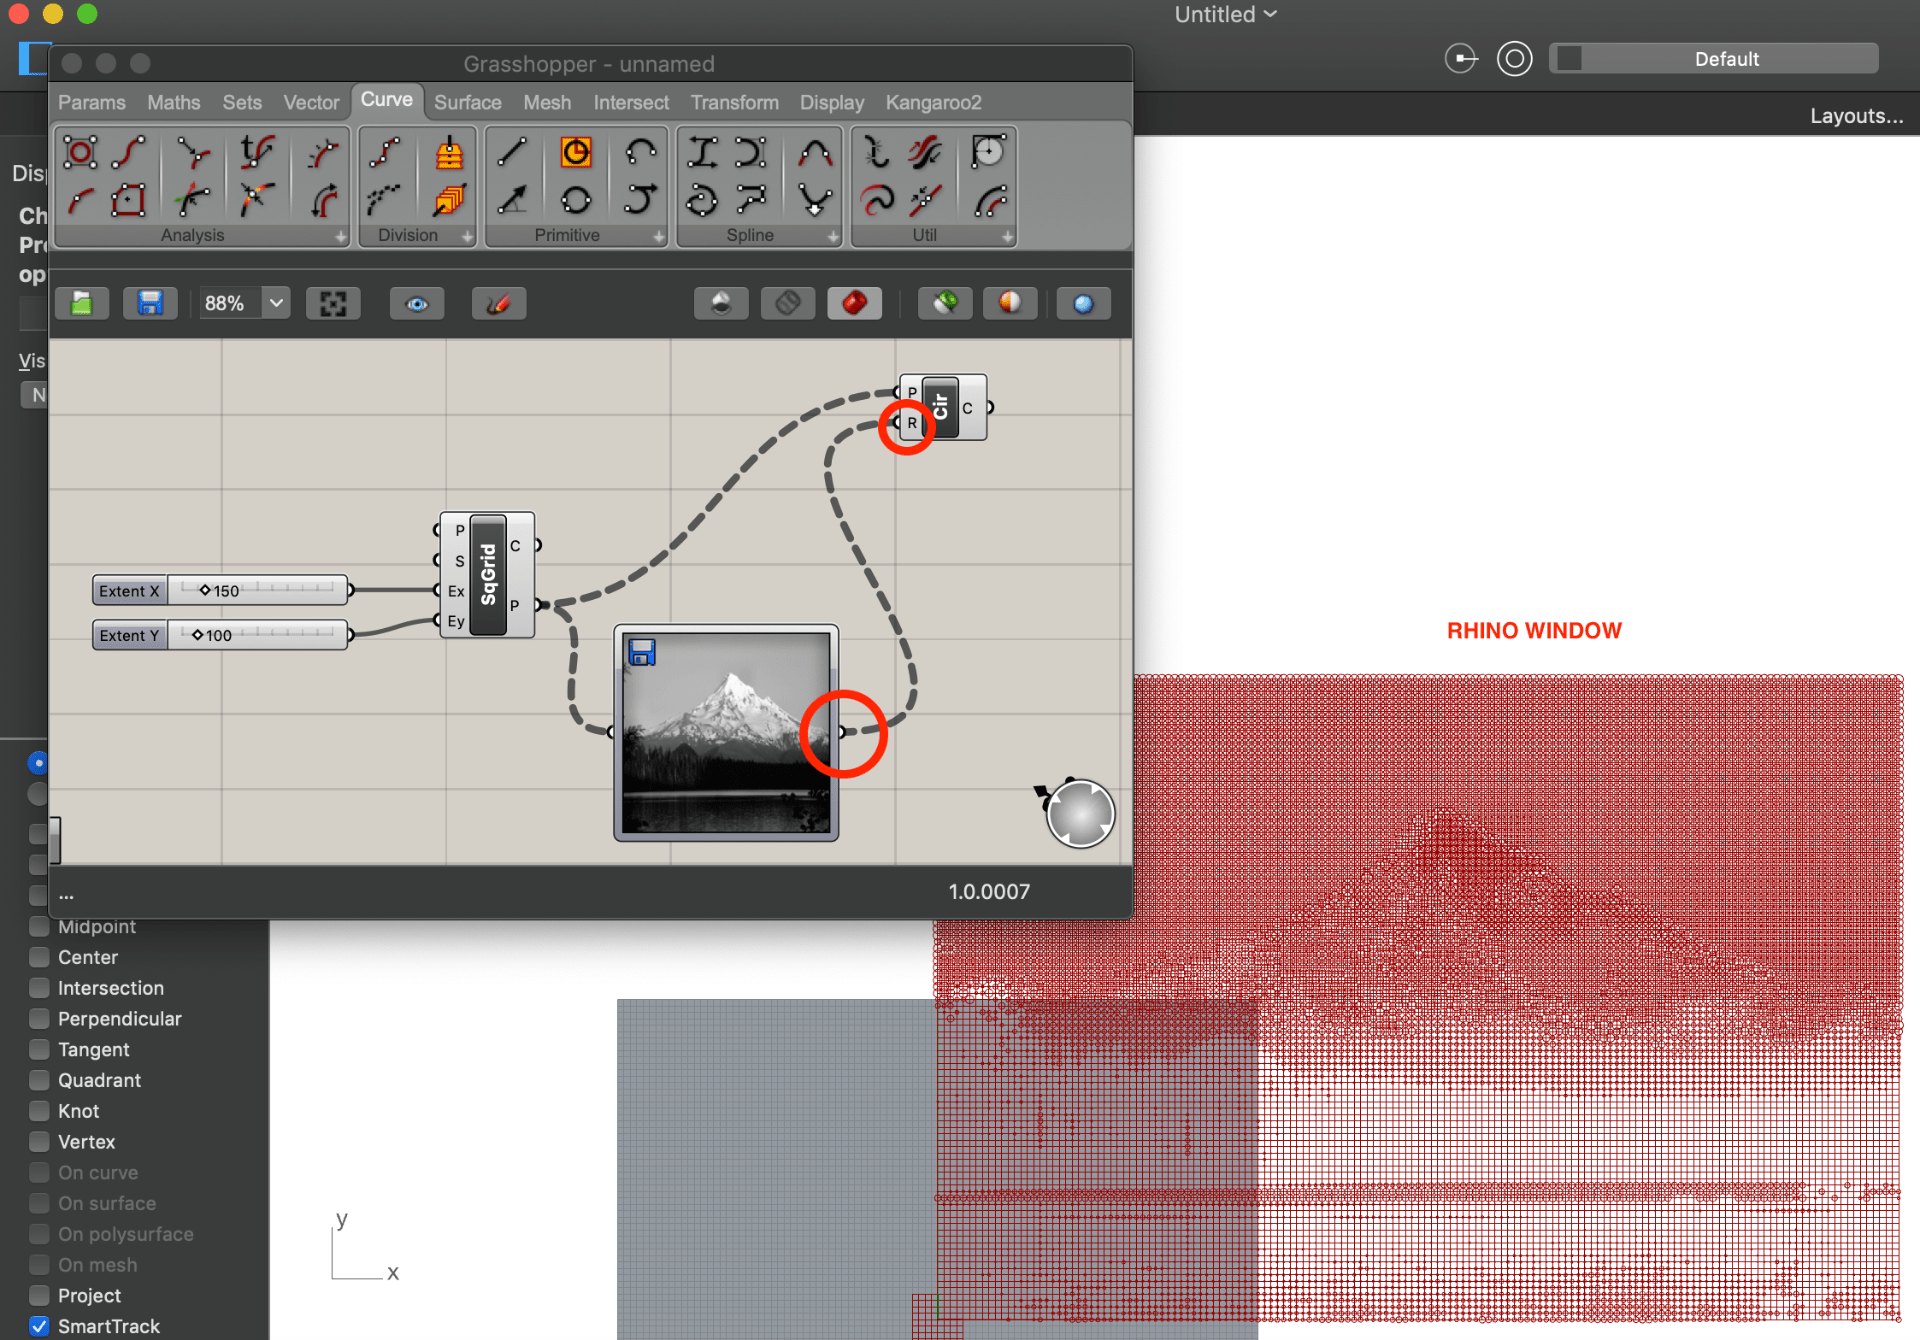
- In the ribbon, select the Curves Tab>Primitive>Circle (circle defined by base plane and radius). There are a number of other ways to construct a circle, ensure you select the correct one. A component appears:

- Again notice the inputs P and R (Plane, Radius) and the output C (resulting Circle)
- Connect the “P” (Points) output of the Square Grid to the “P” (Plane) input of the Circle.
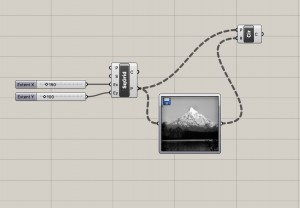
- Connect the output of the image sampler to the “R” (Radius) input of the
- Notice our circles are overlapping (They are too big.) Try testing different grid numbers and radius sizes.


Commands: Default Shortcut or Search Term
- Component Search: Double Click or Spacebar
- SquareGrid: “SQGR” (appears in search as “square”)
- Number Slider: “#<#<#” where first digit is lower bound, second digit is default value, and third digit is upper bound. Simply typing a number into the search bar will also create a number slider set to that value.
- Image Sampler: “IMA”
- Circle: “CI”