Category: Topic Schedules

Fall 2016 Tentative Schedule

R Club meets every Thursday from 2-3:30 PM in 006 Straub.

Topic R Packages
Week 2 Data visualization ggplot2
Week 3 Data wrangling dplyr, tidyr
Week 4 Reproducible, dynamic reports rmarkdown
Week 5 Programming, simulation and elegant coding
Week 6 Simulation
Week 7 Regression, principal components analysis (PCA)
Week 8 Structural equation modeling (SEM) lavaan
Week 9 Thanksgiving
Week 10 Neuroimaging in R or meta-analysis metafor?

Wintertime R Fun!

R Club continues this quarter in the basement of Staub, room 006, Tuesday 3:00-4:20p. This quarter we’ll return to the workshop/consultation format. If you have a problem you want to workshop at R Club, or something cool you want to share, fill out this form.

Here’s our current schedule:

Week 2 – Bring your past projects in R for show and tell
Week 3 – Creating a database for Yelp Challenge data set
Ongoing – Let’s play with this enormous data set from Yelp!

Requests

Fall 2015 Schedule

Submit any request for basic or advanced consultation.

On Deck

We’ve also had some requests from new users for SEM, and group comparisons.

Requests

What’s lined up for R Club?

Next week (week 7) is Regular Expressions Show-and-Tell! John, Matt, and Rose will have some short presentations on how they’re using regular expressions in R (and/or python, in Matt’s case), and then we can spend the rest of the time asking questions, maybe working in small groups if folks have some more targeted questions for any of the presenters.

Week 8 will be a consultation for Matt. He started describing his project a little bit, and so far it sounds like “a big ball of wibbly wobbly timey wimey… stuff,” to quote The Doctor.

doctor_who_gif_by_stephyrae33-d5g2boi


Don’t miss it! It’s going to be awesome.

What’s lined up for R club?

Next week we’ll have another consultation about analyzing breaks in time series data (i.e. when you have a long string of repeated measures, how can you tell when a participant “breaks” from his/her pattern?). We’d love to consider a range of approaches, from basic time series models like ARIMA through more flexible multilevel modeling approaches (which may actually make the most sense, because the data are nested). To see what time series stuff we cover in 612, see this rpubs document (the second half covers autocorrelation and times series). If you want to get in the mood, go to Naomi’s brown bag talk on Friday (tomorrow) 12pm-1pm in Straub 256. She’ll be talking about an MLM approach for these data.

Week 6 will be map day! Yes, maps, like for finding treasure. Except these maps won’t be about treasure so much as outreach and recruitment… There are so many great mapping packages in R! I did a little mapping stuff last year for a class in library sciences, so I jotted down some code real quick to give you an idea of how some of this could work:

# let's say we posted flyers at prince pucklers, moss street day care, and peace health hospital
# and let's say two families told us they saw flyers at moss street
library(ggmap)
library(ggplot2)
flyer1 = geocode("moss street day care eugene or") # this is literally a google maps search!
flyer2 = geocode("1605 E 19th Ave Eugene, OR 97403") # this is the address for prince pucklers
flyer3 = geocode("peace health hospital eugene or")
family1 = flyer1
family2 = flyer1
map.data = rbind(flyer1, flyer2, flyer3, family1, family2)
map.data$type = c(rep("flyer", 3), rep("family", 2))
map.data
base.map = qmap("eugene, or", zoom=14, maptype="roadmap") # get a map of eugene (again, this is just a google map search)
map = base.map +
geom_point(data = map.data, aes(x = lon, y = lat, color=type, shape=type), size=8, alpha=0.5) # add the flyer and family info
qmap("university of oregon", zoom=14, maptype="watercolor") # just because :)

And for week 7, we’re going to talk about model selection in machine learning/statistical learning/data mining/whatever you want to call it. Into the data mines!
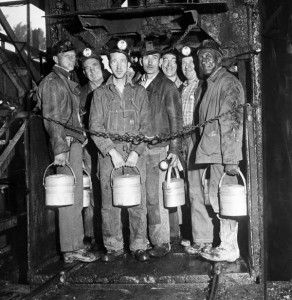
datamine

Winter 2015 R Club Schedule

1/6 – Rose (611 Highlights, part 1); Jacob (generating network graphs from plain text notes)

1/20 – John (611 Highlights, part 2); Jason (CLT simulations); Rose (write your own functions!)

2/3 – Aaron (“tidy” data); Rose(generate correlated random data)

2/17 – John (interactive embedded plots); Rose (controlling color in plots)

3/3 – Jason (exploring common statistical tests); Jessica (plotting)

Fall 2014 R Club Schedule

9/30:
Intro (swirl, and practice with datasets) – Rose
Bootstrapping – John

10/14:
Dealing with missing data by multiple imputation using amelia() – Rose
Compiling text files into one data frame – Jessica

10/28:
Centering and standardizing with scale() – Rose
Quiz grading script – Jacob
Choosing graphs with the graph catalog! – Jessica and Shahar, in spirit

11/11:
simulations – Erik (and/or John?)

11/25:
MLE – Josh
Sorting variables in a data frame with arrange() – Rose
Working with count data: poisson regression – Jason
Manuscript workflow for R + .doc – Jacob

Presenters have the option to request that we do a code review for them. Note that we probably don’t have time to review long pieces of code, so if you are planning a long-ish presentation but would like review, consider picking just one portion of your code that you’d like to get targeted feedback on.

Some other potential nuggets:
Datasets in R
ggplot2
R + Latex