CAS-IT Data Services

Helping University of Oregon faculty, students, and staff with their data needs. Come to office hours to learn more!

January 12, 2016
by Eren Kavvas
0 comments

Making the Most of Office Hours

Howdy!

This week has been abuzz with students interested in getting help with their data needs. The CAS-IT Data Services GTF (me) can help you find and analyze your data and also provide guidance on statistical software (like R, SPSS, and STATA).

But, although it might seem as such, I am no wizard. Therefore, if you do not want to spend too much time waiting in my office while I search Google for the answer to your question, I have some recommendations!

  1. Have some questions in mind. If you’re confused, think about why. Are you having trouble with the software? Can you not find the right sources? Is the statistical computation giving you trouble? It helps me help you if you know with what you need help. (That’s a mouthful!)
  2. Email me some background beforehand. I can be a better resource to you if I’ve done looking into the subject beforehand. For example, if you need help with R, it would be great if you could email me your problems a few days before so I can make sure to have answers for you when you come in. Believe it or not, a lot of what I do involves searching on Google over and over again until I find something that works. So, it might be a little boring if you have to sit and watch me do that during office hours. Sending it ahead of time gives me time to prepare.
  3. Make an appointment. Some days no one comes into my office. Some days there’s a line. If you set up and appointment during my office hours, then you can be seen without waiting.

These are also good rules for office hours in general. The GTF’s on campus want to help you! If you can make that mission easier for us, it also makes getting your questions answered easier, too.

November 30, 2015
by Eren Kavvas
0 comments

What Software Should I Use?

You might be doing some research. You might be thinking about what new technology you want to learn. You might just be curious about these blog posts!

The big question to many researchers is: what statistical software should I choose? Economists tend to prefer STATA, psychologists tend to prefer SPSS, and pretty much everyone loves R. So what should you try to learn (or use) for your research?

STATA is a powerful tool. Most importantly, the labs in SSIL provide this software free of charge. STATA is a powerful software that can handle big data sets and also has a strong computing ability. The biggest issue with STATA, however, is that it is harder to use than SPSS and it is not free. For example, if you just want to take a gander at your data, you’ll probably need some knowledge of coding in STATA before you do it. Furthermore, if you end up moving on to a job or another degree where STATA is not provided, it can be very expensive. Because it is expensive, there tends to be a smaller online community of people who can answer your questions when you are struggling with a problem.

Pros: powerful, used commonly in economics; Cons: expensive, more difficult to learn

SPSS is also a proprietary software. This means that like STATA, you will have to purchase it. There are some computers on campus with SPSS, like the lab in Straub, but it can be harder to find than STATA. SPSS, however, it more of a “point-and-click” software. This means that in lieu of coding, you can utilize the built-in functions to do basic analysis. On one hand, this can be incredibly useful to someone who has an immediate need and no time to learn the language. On the other hand, these functions are limited and do not have much depth to their analysis.

Pros: simple to use for introductory tasks; Cons: expensive, not as powerful

R is sort of the end-all-be-all of statistical software. It is free and therefore has a huge online community of people willing to answer your questions. These means that if you get stuck, there was probably someone who got stuck in the same place before you, posted the situation online, and now there exists a plethora of answers. And, if you can’t find your questions, StackExchange gives users the ability to post their questions to a forum of knowledgeable community members. R also has some of the best visualization abilities and is extremely strong at more complex analyses. The one down-side? R has the steepest learning curve of the three software. That being said, there are a many free online classes to help you learn.

Pros: free, great community for help, very powerful; Cons: difficult to get started


November 5, 2015
by Eren Kavvas
0 comments

What is a Pirate’s Favorite Statistical Software?

R!

It probably would have been very helpful to old-timey pirates to know R. Speaking of which, if YOU would like to learn R like a pirate, then I’d recommend this fun, interactive MOOC called Try R. It is even pirate themed!

Jokes aside, R is an incredibly powerful tool to analyze your data sets. Not only can it be helpful for cleaning data (I can hear the nostalgic *sigh* coming from people who have worked with large data sets) but it can also do a plethora of statistical analysis –like regressions and t-tests– as well as graphically represent your data. Learning R can be a challenge, however, if you are used to working with more straightforward software like SPSS. There is no clicking your way to an answer in R. That being said, beyond an initially steep learning curve, you can familiarize yourself with the intermediate components of R rather quickly if you are willing to put in some work in the beginning.

Also, R is FREE. Why? Because R is an open source software. This means another great this as well: the amount of online help for R is huge! There are tons of online learning modules and when your getting into the weeds and doing some cleaning/analysis yourself, there are whole online communities of people with similar questions. Furthermore, this online communities also include experts in R who will kindly answer questions (assuming you tried to do research and answer the question for yourself first).

Piratey,_vector_version.svgSo upwards and onwards mayties! Let’s learn some R (rrrrr)!

Here are a few resources to get you started:

Download R here

Download R Studio here (R Studio is a display format that makes R much easier to use. I recommend doing your work in R Studio. R Studio is free.)

Learn R within R Studio here (One of the best online learning modules will also help you download necessary libraries. Also free.)


October 29, 2015
by Eren Kavvas
0 comments

Why Should I Care About Optical Character Recognition (OCR)?

OCR is an important tool in the digital humanities. It gives us the ability to use digital tools to analyze written text.

What does that mean?
Let’s say you are Indiana Jones (hey, why not?), and you are exploring an underground castle. As you walk through the deep tunnels, you find an amazing library! One of the texts in the library is a never before known Shakespearean play that Shakespeare himself wrote for the the king of that underground castle. Because you’re Indiana Jones, you believe that there are very important clues in this text. So, you take the book back to your laboratory and decide that you want to analyze the number of times certain words are printed so you can figure out your next step. Counting the words by hand, however, is not an option because the world might end in 48 hours if you do not solve the puzzle! Luckily, a beautiful scientist works in your lab and she has a scanner and some OCR software. First, she scans the play into a .pdf. Next, she uses OCR software to turn the file into a digitized, searchable document. Then, with her coding and programming knowledge, she converts the messy, digitized copy into a workable document. Finally, she analyzes the text! And boom… you’ve solved your puzzle!
Now, even if you are not Indiana Jones, OCR can be a great tool. For example, many records in economic history have not yet been digitized. If you wanted to do any sort of calculations with the numbers, you would need them in a excel document, which is something OCR can do. Or, some lesser known texts and older newspaper articles are not on the web. For these, you could also use OCR to digitize them and then analyze different components.

I encourage those interested in learning more about OCR come to the data services lab office hours for guidance on where to start!

Office hours are: Monday 12:30 – 3:30, Tuesday 11:30 – 3:00, Thursday 11:30 – 1:30

October 29, 2015
by Eren Kavvas
0 comments

Digital Humanities and Data Services Join Forces!

We are exploring the amazing world of digital humanities! With the immense amount of resources available, it’s hard to know where to start. Many departments– from English to Art History– are using digital humanities as a new tool for research. Often times, digital humanities implements quantitative methods to examine traditionally qualitative topics.

Data services has been interested in OCR and we found a great site for anyone interested in learning more! Scroll through our links of digital humanities resources at web resources. What digital humanities area are YOU interested in? Comment below and we’ll try to do a workshop for you!

October 26, 2015
by Eren Kavvas
0 comments

Introducing the 2015-2016 GTF

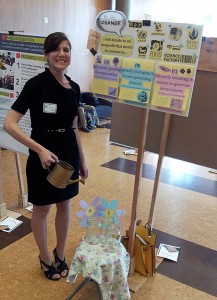
Eren at the 2015 graduate student research fair.

Eren at the 2015 graduate student research fair.

Hello world! CAS-IT would like to introduce Eren Kavvas as the 2015-2016 Data Services Graduate Teaching Fellow. She will be the one answering your data questions by holding office hours and updating this blog (but hopefully not in the third person much longer). Eren is a masters in nonprofit management student here at the UO and she has a background in digital humanities and quantitative methods. She wants to help you locate, analyze, and present your data. In her spare time, you can find Eren watching foreign movies and trying new recipes. If you would like to contact Eren about your data service needs, you can reach her at ekavvas@uoregon.edu. Her office hours for Fall 2015 are:

Mondays 12:30-3:30 pm

Tuesdays 11:30-3:00 pm

Thursdays 11:30-1:30 pm

Skip to toolbar