![]()
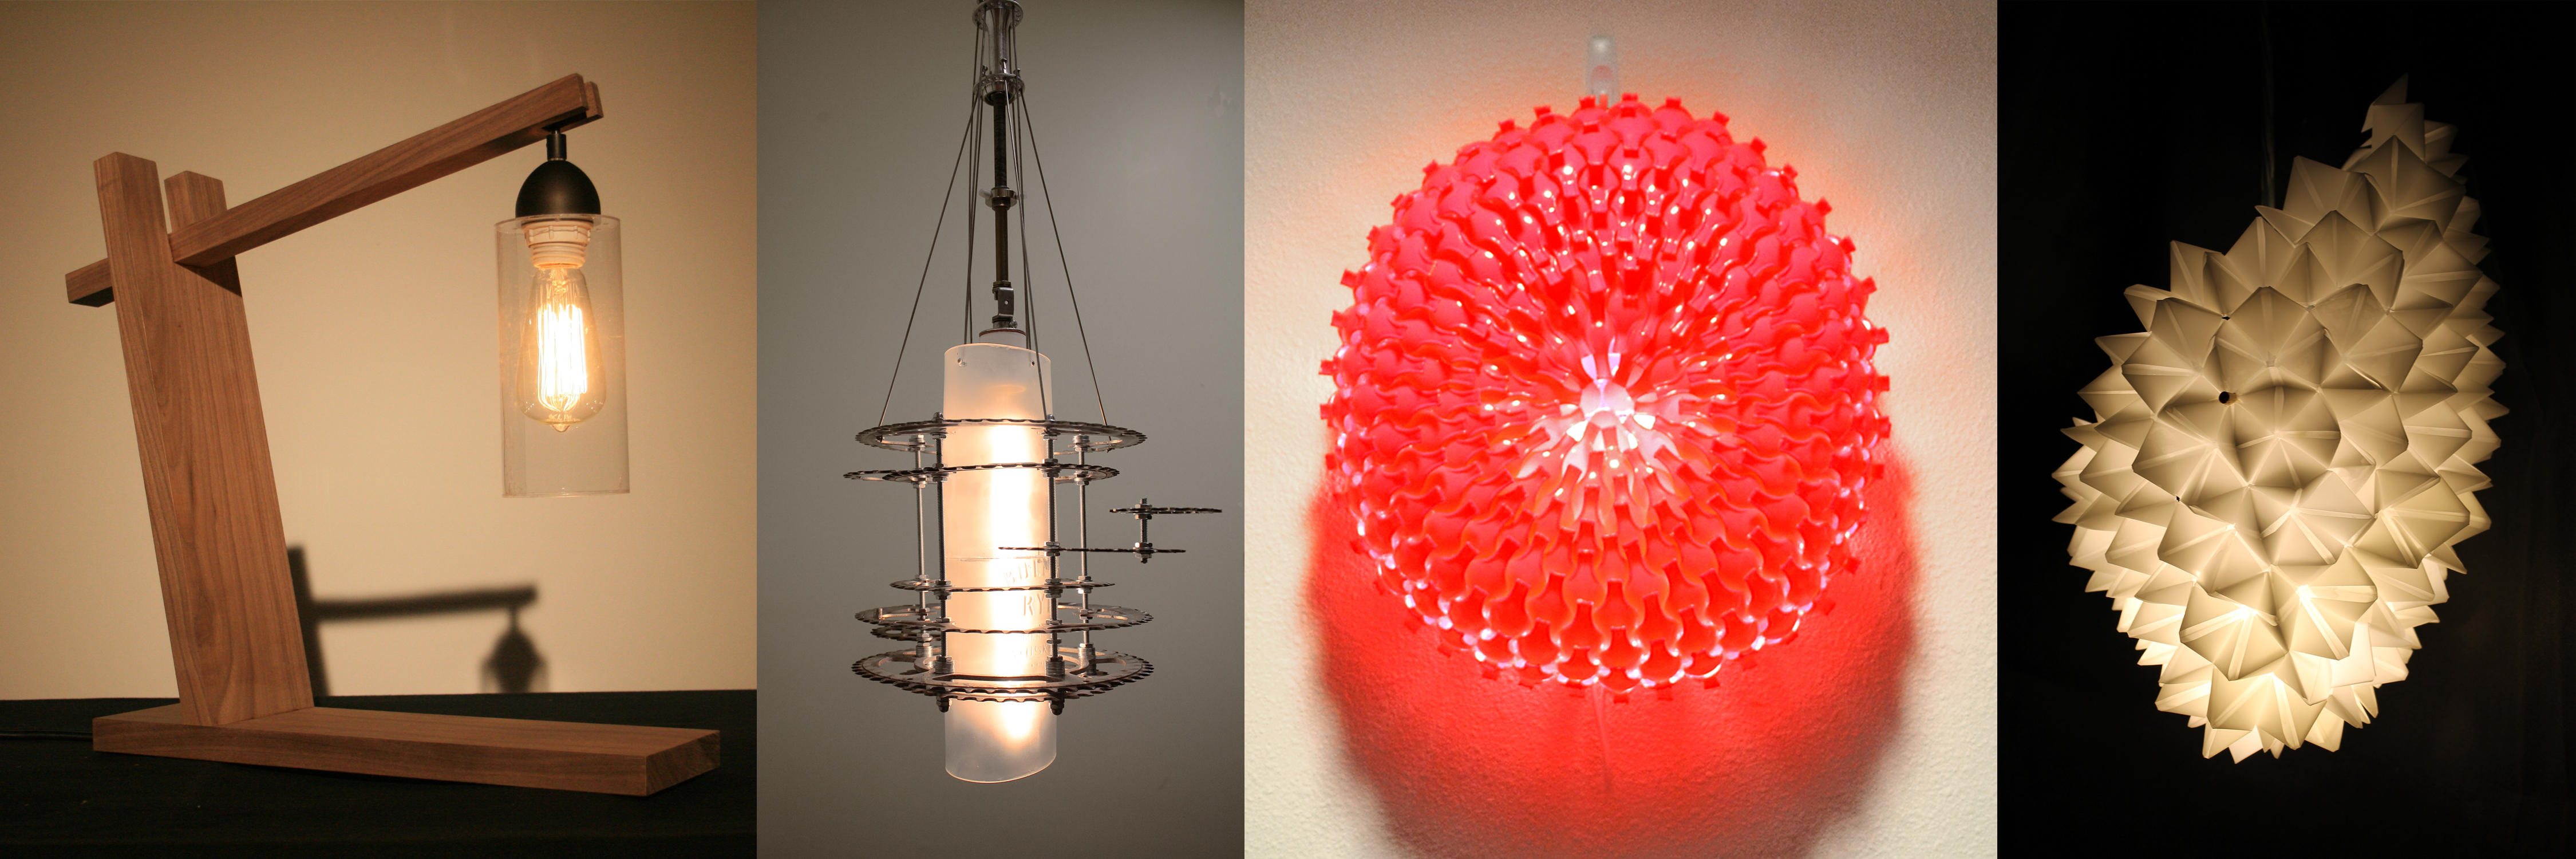
(Ladybug + Honeybee photo source)
Ladybug+Honeybee
Ladybug and Honeybee are two environmental analysis plugins for Grasshopper for Rhino. Ladybug combines geometry in Rhino and the parametric interface of Grasshopper with open-source weather data from EnergyPlus (.epw files) to create site specific climate analysis graphics and diagrams. Honeybee connects Rhino geometry and Grasshopper functionality to a selection of advanced energy modeling and simulation programs such as Radiance, Daysim, EnergyPlus, OpenStudio, and gbXML.
“Ladybug and Honeybee are two free and open source environmental plugins for Grasshopper to help designers create an environmentally-conscious architectural design.” (Food4Rhino)
For complete download files and instructions, visit Food4Rhino to download and GitHub for instructions. For additional help, I highly recommend following the download and getting started series by Chris Mackey.
Note: For those intimidated by the Grasshopper interface, these two plugins are straightforward and approachable. Likewise, there is a huge support network of videos and forum-posts easily searchable online.
Diagram
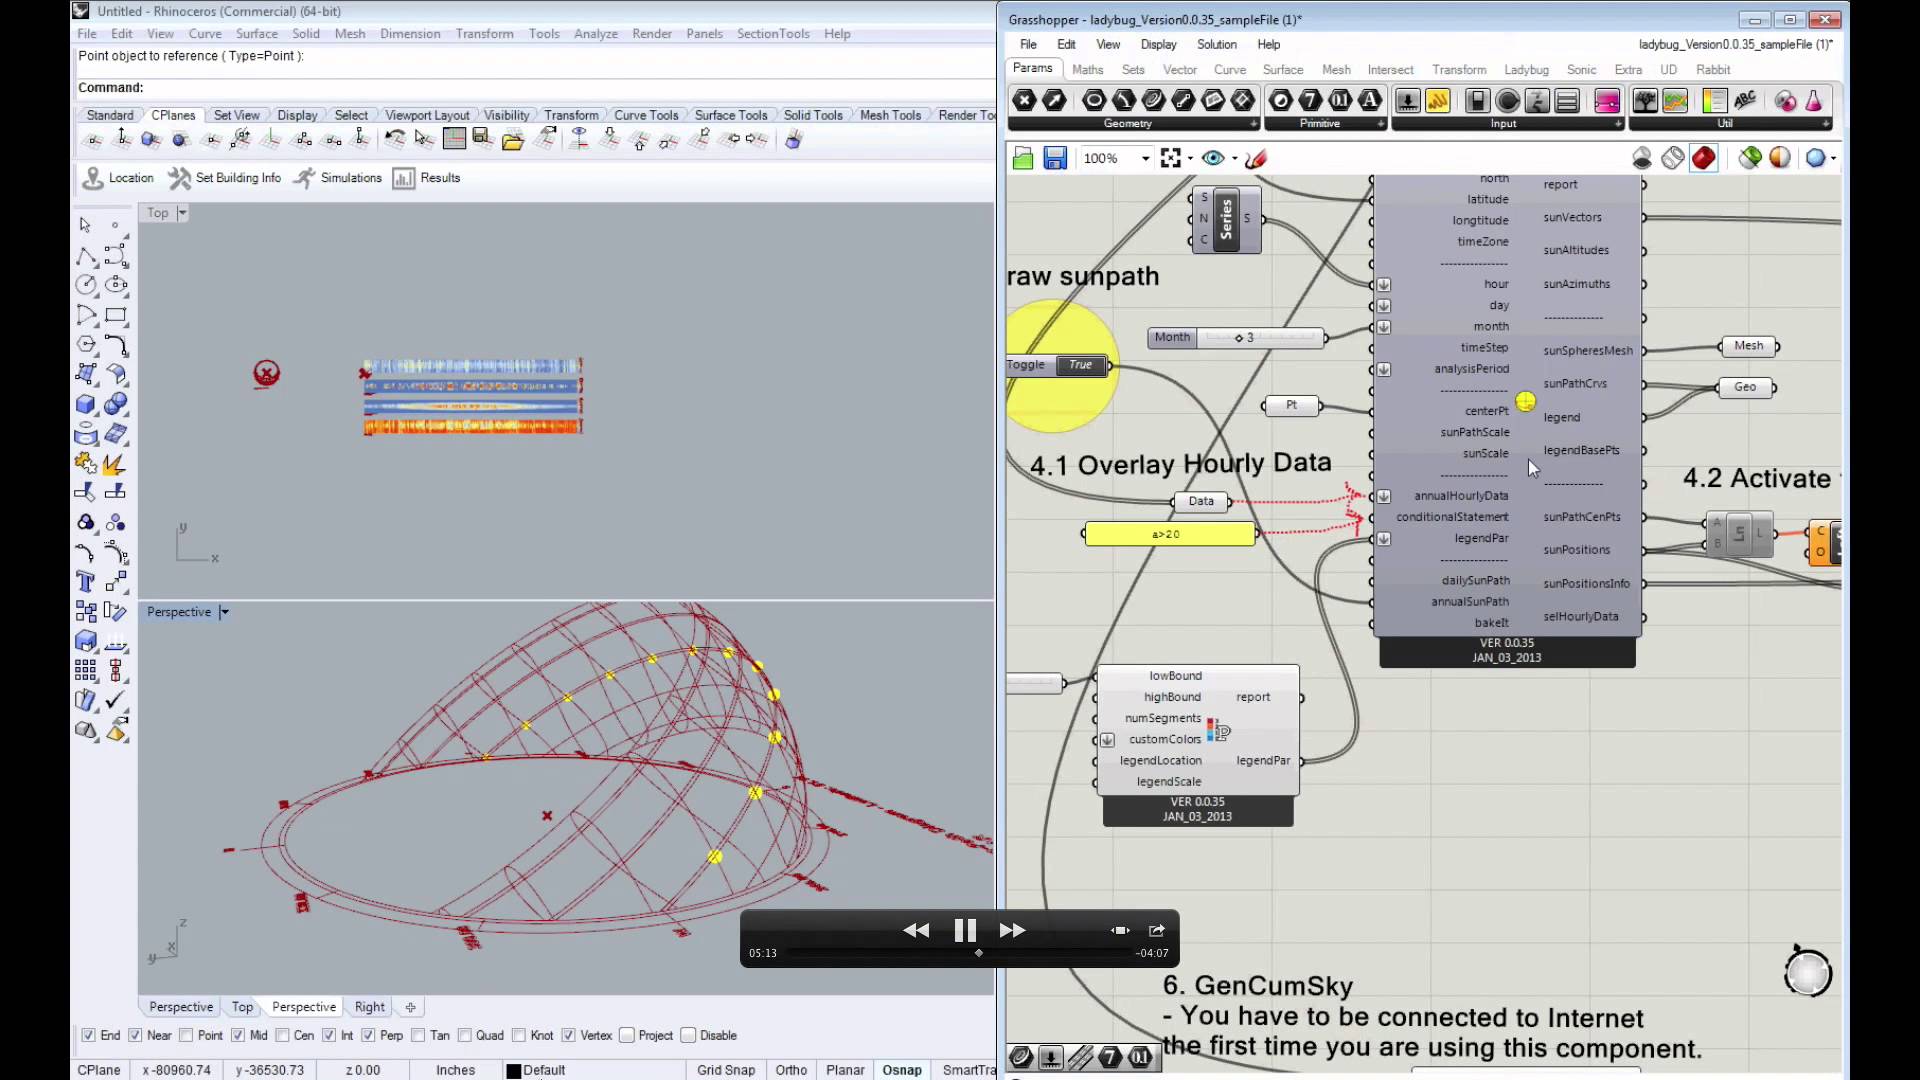
Once Ladybug + Honeybee are installed and working, you can start producing accurate diagrams quickly and easily. Many diagrams are built into the functionality of the plugins, but it is also possible to generate geometry that allows you to create diagrams and design in an informed way. Below are some simple video tutorials created by Mustapha Sadeghipour and Chris Mackey that display some of the capabilities of the plugins. Some of these diagrams and basic functionality are described in the download and getting started series by Chris Mackey.
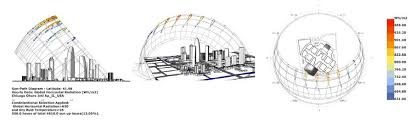
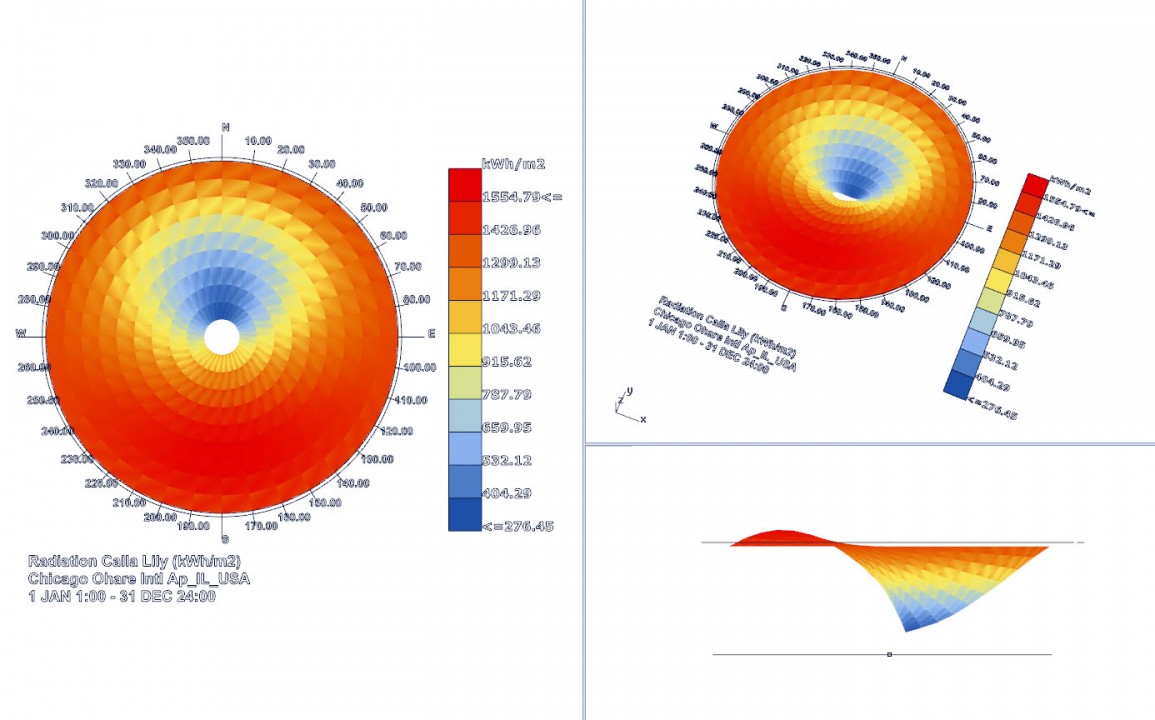
Sun Path
Ladybug allows you to visualize sun-path information for any location. The interface is fully customizable, however using the data from a EnergyPlus (.epw) file will allow site specific analysis. Daylighting diagrams can be generated from this set of tools in Ladybug and can be color coded in any way. Likewise, the geometry output from this function can be used in Rhino to inform the shape and solar response of any design. Mustapha Sadeghipour has a series of tutorial videos that are very thorough.
[tutorial videos] by Mustapha Sadeghipour
Note: pay close attention to the components he uses, he often forgets to mention what they are specifically called
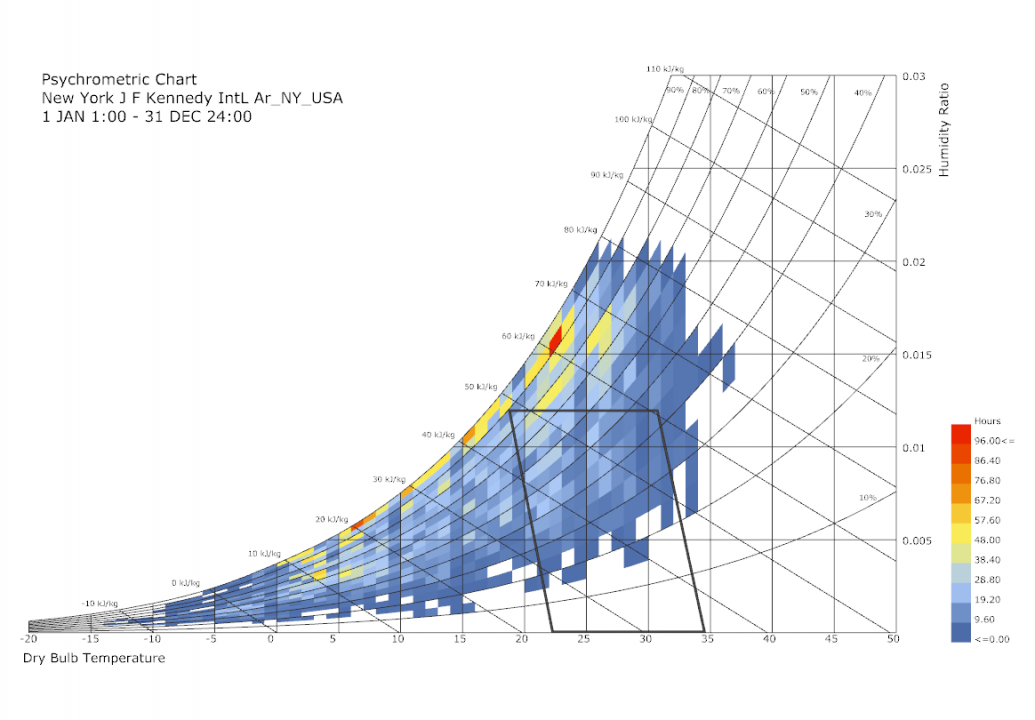

Thermal Comfort
Ladybug + Honeybee also allow you to analyze thermal comfort. The plugins can generate the psychometric chart from a EnergyPlus (.epw) file, along with many other diagrams. Also, the plugins can get detailed enough to generate a dummy-form to show which areas on the body are experiencing what temperatures! These analyses can be done on indoor and outdoor comfort and account for the built geometry of a design.
[tutorial videos] Chris Mackey